
Discover the practical steps to calculate correlation coefficients in Excel, a key skill for anyone looking to enhance their data analysis capabilities. This guide provides a clear pathway to understanding and interpreting statistical relationships using Excel. We’ll take you through the process of calculating correlation coefficients, helping you gain the proficiency needed to make well-informed, data-driven decisions.
Introduction
In terms data analysis, understanding correlation coefficients in Excel is essential. This concept helps us see how two things relate to each other. For example, it can show if changes in a product’s price affect its sales, or if there’s a connection between the stock prices of two companies.
Learning about correlation coefficients helps us make smarter decisions by revealing patterns in our data. To do this in Excel, we use data that can be measured in a straight line, like prices, volumes, heights, or weights. Some types of data, like locations or gender, don’t fit this method, but there are other ways to analyze them. This post will guide you through the easy steps to calculate and understand correlation coefficients in Excel, enhancing your skills in data analysis.
Calculating Correlation Coefficients in Excel
Let’s demonstrate how to calculate a correlation coefficient in Excel, using a practical example.
We’ll examine the stock prices of two well-known companies, Apple and Microsoft, over a period of 12 months. The goal is to determine if there’s a correlation between the stock prices of these two companies.
Put simply, we’re testing to see if the stock price of Apple tends to move in tandem with the stock price of Microsoft. Does an increase in Microsoft’s stock price usually coincide with an increase in Apple’s stock price, or vice versa? This analysis will help us understand if and how these two stock prices are related
Process for Calculating Correlation Coefficients
Organize Data
The initial step in calculating correlation coefficients in Excel involves neatly arranging your data.
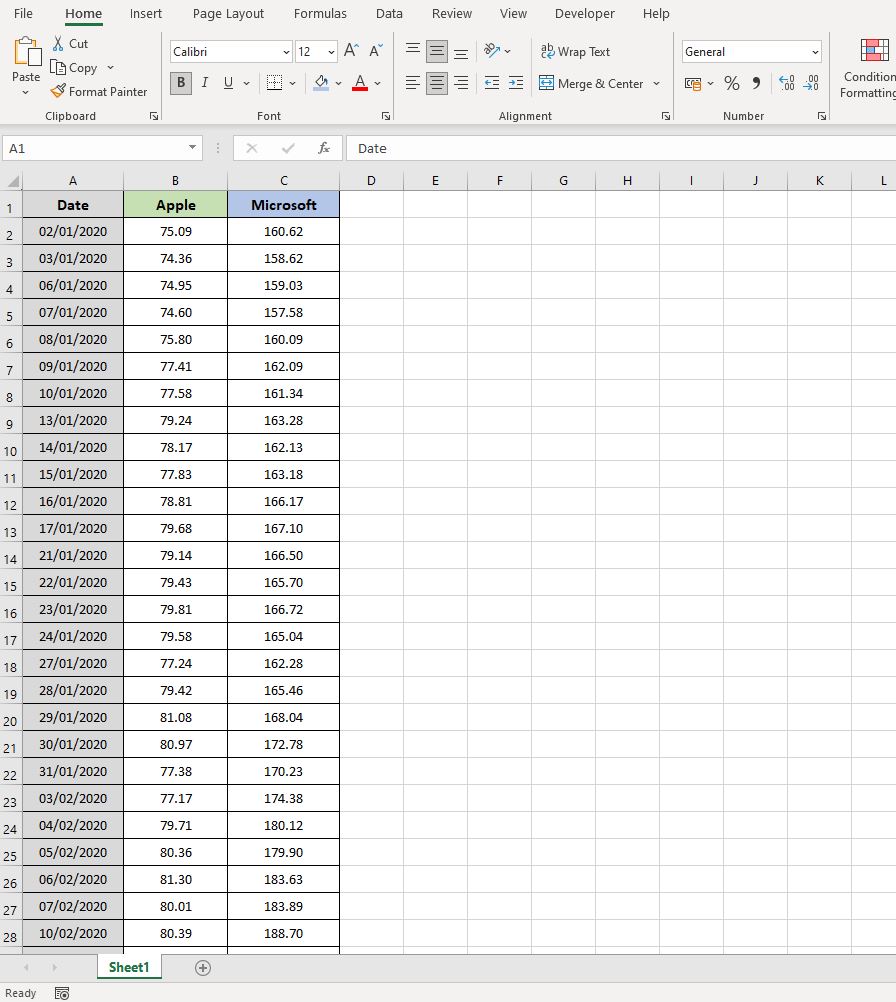
In our example, we’ll be using the daily closing prices of Apple and Microsoft. To organize this information, you’ll set up your Excel sheet as follows: Column A will list the dates, Column B will show Apple’s closing prices on those dates, and Column C will display Microsoft’s closing prices corresponding to the same dates.
Visualize Data
While not strictly required, creating a visual representation of your data is highly recommended. It offers an intuitive grasp of the relationship between the two variables and can provide early hints about what the correlation test might reveal.
For our purposes, a simple line chart is effective. This type of chart will clearly display the trends in the closing prices of Apple and Microsoft, making it easier to spot any patterns or similarities in their movements over time.
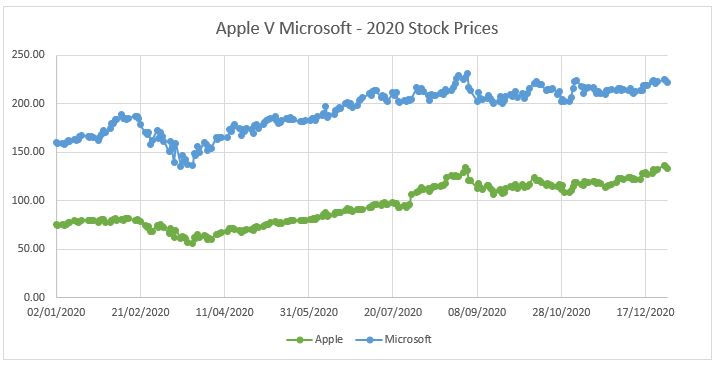
The line chart makes it easy to see that the stock prices of Apple and Microsoft often move in the same way. When one goes up, the other usually does too. They also tend to go down at the same time. This similar pattern gives us a hint that there might be a correlation between them.
Correlation Coefficient Function
Now, let’s calculate the correlation coefficient for the Apple and Microsoft stock prices. In Excel, we do this with the CORREL function. This function is straightforward to use:
- = CORREL(Array1, Array2)
Here, ‘Array1‘ is the set of data for the first item (in our case, Apple’s stock prices) and ‘Array2‘ is for the second item (Microsoft’s stock prices).
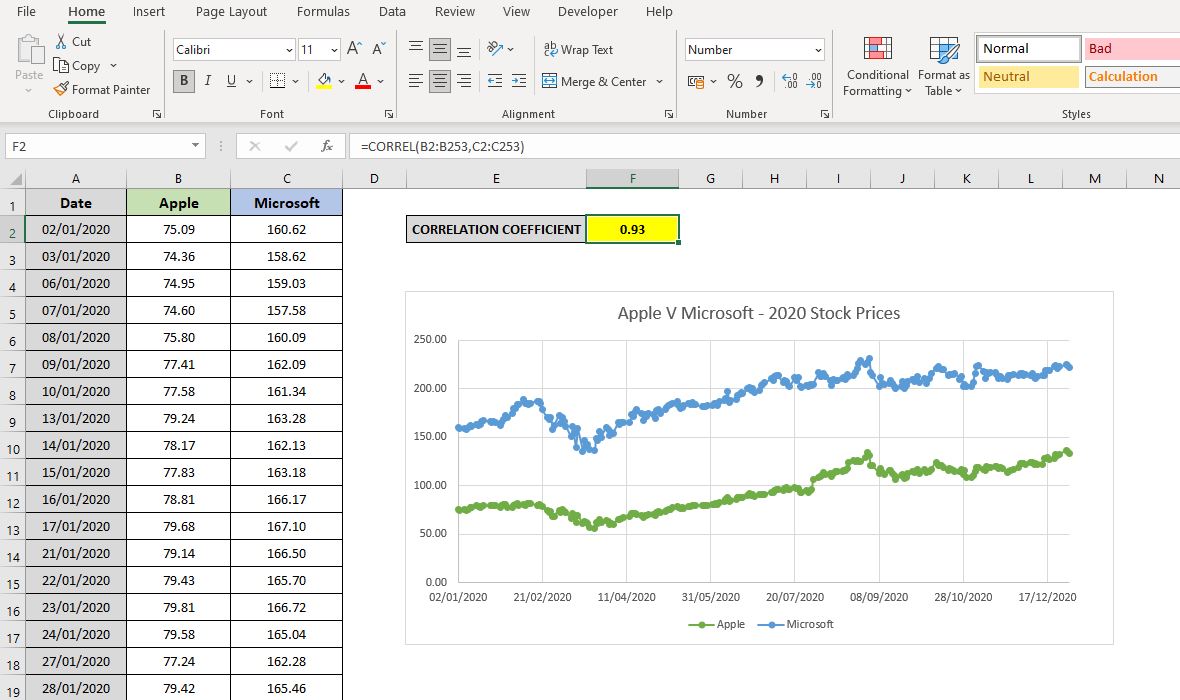
In our example, Apple’s daily stock prices are listed from B2 to B253, so this is Array1. Microsoft’s daily stock prices, from C2 to C253, will be Array2.
So, the formula we’ll use to find the correlation coefficient looks like this:
- = CORREL(B2:B253, C2:C253)
Interpreting the Result
After using the correlation coefficient formula, we got a result of 0.93 for our example.
So, what does 0.93 mean? Let’s break it down:
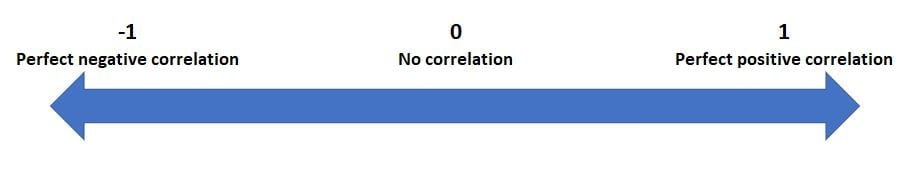
- The correlation coefficient value will always be between -1 and +1.
- A negative number (closer to -1) means that when one stock price goes up, the other tends to go down.
- A positive number (closer to +1) means that when one stock price goes up, the other tends to go up too.
In our case, the result of 0.93 is a strong positive correlation. This tells us that the stock prices of Apple and Microsoft usually move in the same direction. When Apple’s stock price goes up or down, Microsoft’s stock price tends to do the same.
To understand this better, a detailed table can provide more insight into what different correlation values mean:
| Positive Value | Negative Value | |
| No correlation | 0 to 0.1 | 0 to -0.1 |
| Weak correlation exists | 0.1 to 0.3 | -0.1 to -0.3 |
| Medium correlation exists | 0.3 to 0.6 | -0.3 to -0.6 |
| Strong correlation exists | 0.6 to 1 | -0.6 to -1 |
The result of 0.93 shows a strong positive correlation between the stock prices of Apple and Microsoft. This means we can be quite confident that if one company’s stock price rises, the other is likely to rise as well.
Similarly, if one falls, the other is likely to follow. This strong correlation suggests a significant link in the movement of their stock prices.
Factors to Consider When Calculating Correlation Coefficients in Excel
Before diving into the calculation of correlation coefficients in Excel, there are a few important factors to keep in mind:
- Data Quality: Accurate and relevant data is crucial. Incorrect or outdated data can lead to unreliable correlation results. In our example, this means using the most current and precise closing prices for Apple and Microsoft stocks.
- Sample Size: The reliability of correlation increases with a larger data set. In the context of our example, using 12 months of stock price data offers a comprehensive view, enhancing the reliability of the correlation between Apple and Microsoft.
- Outliers: Outliers are unusual data points that can skew your results. For instance, an unexpected surge or drop in Apple’s stock due to a unique event could disproportionately affect the correlation with Microsoft’s stock prices.
- Linearity: Correlation coefficients are best suited for linear relationships. In our case, we assume that the stock prices of Apple and Microsoft have a linear relationship over the period studied.
- Cause and Effect: Remember, correlation does not imply causation. Just because Apple and Microsoft’s stock prices move together does not mean changes in one cause changes in the other. They could be moving similarly due to broader market trends or other factors.
Summary
Calculating correlation coefficients in Excel is a powerful tool for understanding the relationship between two sets of data. In our example, we saw a strong positive correlation between the stock prices of Apple and Microsoft, suggesting their prices often move in sync.
However, it’s crucial to consider factors like data quality, sample size, and the presence of outliers to ensure accurate results. Most importantly, while correlation can highlight a relationship, it doesn’t necessarily mean one variable causes the other.
Understanding and applying correlation coefficients in Excel can offer valuable insights in various fields, from finance to research. With careful consideration and proper analysis, this tool can be a significant asset in your data analysis toolkit.
Keep Excelling,

Now that you understand how to calculate correlation coefficients in Excel and have seen their impact on stock prices like Apple and Microsoft, why not take your investment strategy further? Check out our Excel Dollar Cost Averaging Calculator. This tool simplifies your investment planning, helping you make informed decisions to optimize your portfolio.
Start maximizing your investment returns with ease and confidence!