
Understanding how to calculate percentage change in Excel is essential, not just for common tasks but also for making sense of your data. This skill is crucial for both seasoned Excel developers and beginners, as it enables accurate analysis of changes between two values in Excel. Mastering this technique is key to effective data interpretation.
This guide will take you step-by-step through the process of calculating percentage change in Excel, ensuring that you can confidently handle this critical function in your data analysis tasks.
Table of Contents
Introduction
Excel is not just for creating reports; it’s a powerful tool for analysing and interpreting data. The ability to calculate percentage change in Excel is particularly valuable, especially when analysing historical data like sales volumes or financial figures.
Learning to calculate percentage change in Excel helps transform raw numbers into meaningful insights, providing a deeper understanding of trends and comparisons between different time periods or values.
This post aims to demystify the process, making it accessible and straightforward for Excel users at any skill level.
Understanding the Math
It is not a requirement to be a math expert when using Excel, in fact Excel often does all the hard work. However to calculate the percentage change between two values in Excel it is useful to look at the mathematical expression to help understand. he expression for calculating a percentage change is:
- % Change = (Current Period – Previous Period) / Previous Period
Example
Take the following example.
- January sales are 10,000
- February sales are 15,000
Therefore the percentage change is calculated as:
- (15,000 – 10,000) / 10,000
- Which equals 0.50, or a 50% increase.
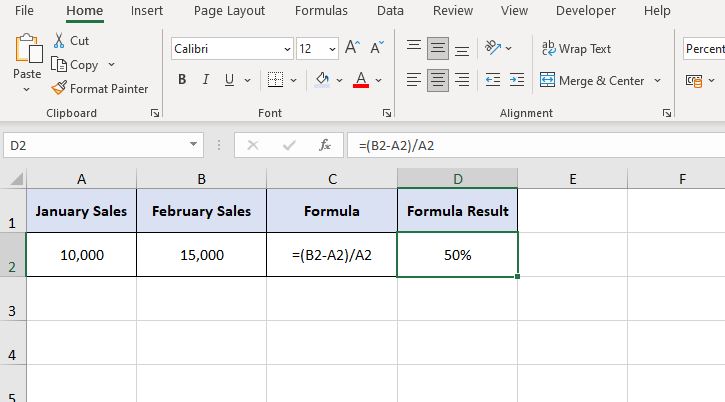
This can be easily replicated in an Excel formula using the same logic. For example if ‘January sales‘ are in cell A2 and ‘February sales‘ are in B2 the formula in Excel to calculate percentage change becomes:
- = (B2 – A2) / A2
Negative Values
The above percentage change formula for Excel works when comparing two positive values, it is important to note that it does not work when one of the values is negative. For that you need a subtle change to the Excel formula for calculating percentage change.
Using the previous example consider if January saw a lot of returns and that made sales a negative value. February was positive and back to normal:
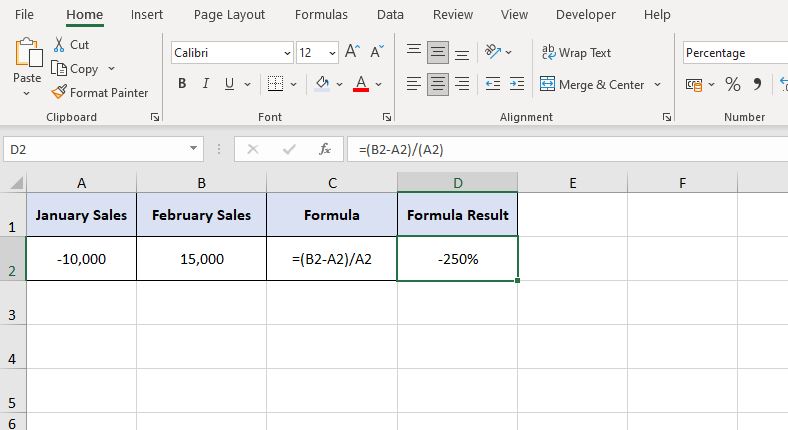
As shown in the image, the result, -250% is not correct. Sales have increased back to normal levels in February (15,000) whereas they were down in January to -10,000.
Solution: The ABS Function in Excel
The solution to this problem is found using the ABS function in Excel. The ABS function is a way to express a value in its absolute form, in other words that means it ignores the negative sign and treats the value as a positive. The ABS function should be used against the divisor to ensure you always calculate an accurate percentage change when dealing with values that can be either positive OR negative.
In Excel that means the formula to calculate percentage change in Excel between two values is expressed as:
- =(B2 – A2) / ABS(A2)
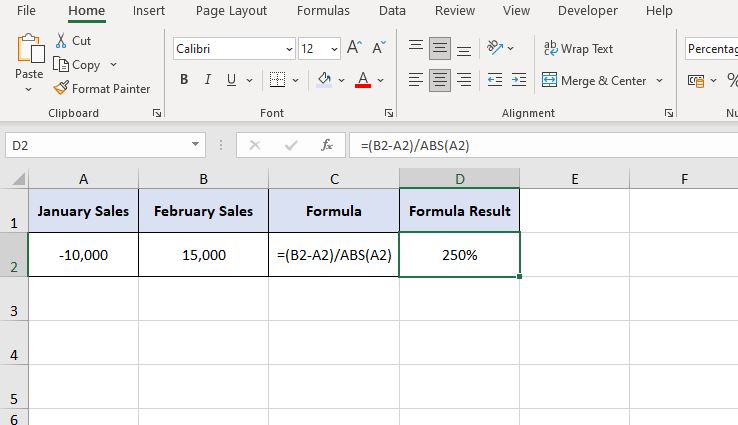
The result is now accurate and shows that February sales actually increased by 250% from the January low of -10,000.
Using the ABS function on the divisor is a good habit for Excel developers to get into as you can never tell when those numbers might go negative and confuse the users of any report.
Conclusion
In conclusion, learning how to calculate percentage change in Excel is a valuable skill that enhances your data analysis capabilities.
As we’ve explored, whether dealing with positive or negative values, Excel offers the flexibility and functionality to accurately compute these changes. Remember, using the correct formula and understanding the logic behind it is key to achieving precise results.
By mastering this essential skill, you empower yourself to derive more meaningful insights from your data, making your Excel reports not just informative but also insightful.
Keep Excelling,
Now that you’ve mastered calculating percentage change in Excel, you’re well on your way to becoming an Excel wizard. But why stop there? The next logical step in enhancing your Excel skills is learning how to sort data effectively.
Discover how to organize your data with precision in our next post, ‘How to Sort Data with Excel.’ This guide will equip you with the tools to manage and analyse your data more efficiently, making your Excel journey even more powerful and insightful.