
To calculate the Median in Excel you need to understand and use the Median Formula. Using the Median formula in Excel is a basic concept that any Excel user can learn, this post will show you how to calculate the Median in Excel and also help you understand when to use it and why.
Median Formula in Excel
The Median formula, or Median function, is a statistical calculation in Excel and it takes the format:
- =MEDIAN (number1, number2, number3…)
This is where “number1, 2, 3” etc. represent the range of cells that you want in your Median calculation.
In the below example there are four business areas (A, B, C and D) along with their sales, calculating the Median in Excel is achieved by using the formula:
- =MEDIAN (B4:B7)

The Median is the mid-point of all the values in our range when they are sorted in order (ascending or descending). In the example shown above there are four values so ordered from smallest to largest they would look like:
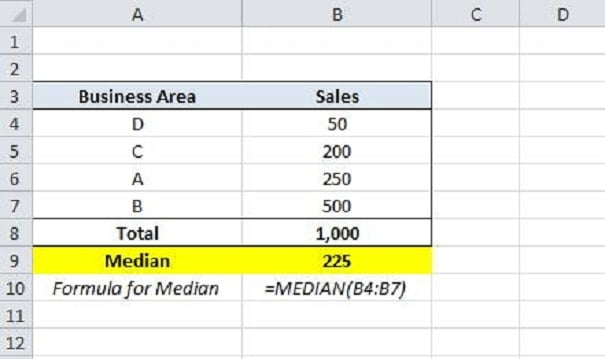
The mid-point is the value between the second (200) and third (250) values. The middle of 200 and 250 is 225, you could calculate that by:
- = ((200+250)/2)

Further example of the Median formula in Excel
The mid-point of seven values is the fourth value:

Why use the Median formula in Excel?
When working with Excel, analysts often handle large datasets, much bigger than the ones in our simple examples. These examples are designed to make it easy for you to understand not just how to use the Median formula in Excel, but also how the Median is calculated.
The Median is especially useful because it finds the middle point in a range of values, effectively ignoring any extreme outliers (both high and low) that could distort the data. This is a key advantage over using just the Average formula in Excel.
Let’s consider a real-world example to illustrate the difference between using the Average and the Median formulas. Imagine a business analyzing its sales volumes over the past week.
In this scenario, the business had an extraordinary flash sale on Day 4, leading to a spike in sales. Conversely, on Day 7, the website was down for maintenance, resulting in no sales.

Using the Average formula, we find an average of 12 sales per day. While this number accurately represents the weekly average, is it the best predictor for next week’s daily sales?
The answer is no.
The week we analyzed had two unusual events: a one-time flash sale and an unexpected website shutdown. Assuming such events won’t repeat, the average doesn’t provide the best sales estimate for the upcoming week.
This is where the Median comes in. It gives a more realistic daily sales estimate of 10 sales per day for the next week. This number, being two sales less per day than the average, makes a significant difference. Consider the implications if you were the salesperson setting targets!
This basic example highlights how using the wrong measure can significantly impact your analysis. Always consider your dataset and the role of outliers when choosing between the Median and Average formulas in Excel.
Summary
In conclusion, the Median formula is a powerful yet often underutilized tool in Excel. It provides a more realistic insight into data by identifying the central point and eliminating the distortion caused by outliers. Understanding and applying the Median can lead to more accurate data interpretations, especially in datasets with significant variances.
Whether you’re a seasoned Excel user or just starting, incorporating the Median formula into your data analysis toolkit can enhance your decision-making process with more representative data insights.
Remember, the key to effective data analysis lies not just in the tools we use, but in understanding when and how to use them.
Keep Excelling,

Great job mastering median calculations in Excel! Ready for more? Dive into our next guide: ‘How to Remove the First Word from a String in Excel.’ Expand your Excel expertise and streamline your data manipulation skills.