
Harness the power of VBA to simplify splitting an Excel Pivot Table into multiple reports. This comprehensive guide is designed to improve your workflow, ensuring each segment of your Pivot Table data is transformed into individual reports with ease and efficiency.
Introduction
Pivot Tables in Excel are incredibly versatile for data analysis, but when it comes to splitting an Excel Pivot Table into multiple reports for individual evaluation, things can get complex. This guide aims to simplify this process.
Consider a scenario: You have a Pivot Table summarizing sales data by month.
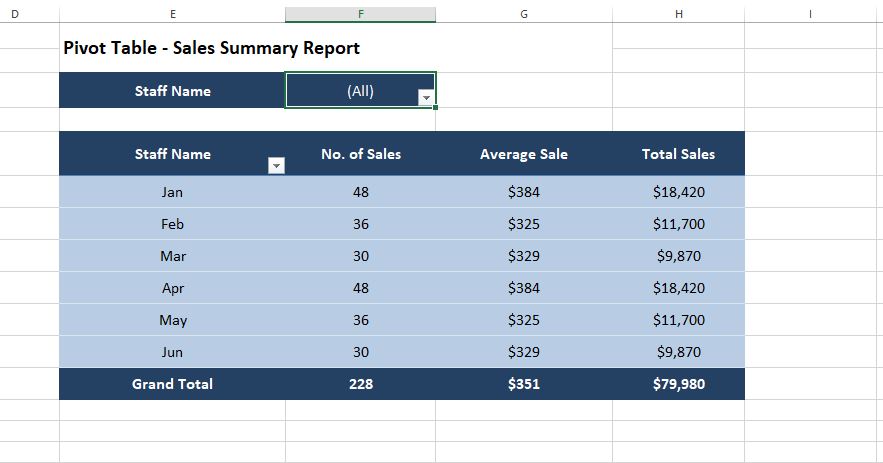
Now, you need the same data broken down for each staff member.
Manually doing this for a large team is impractical and time-consuming. This guide will introduce you to advanced VBA techniques that make splitting an Excel Pivot Table into multiple reports not only possible but also efficient and straightforward.
Organize Your Data
Before diving into the VBA it is best to ensure your data is well-organized.
If you haven’t already then create a Pivot Table (if you need help with this see our guide on Excel Pivot Tables and How to Create One). Make sure you work in a clean workbook and save your file as a macro-enabled workbook (‘.xlsm‘) to accommodate the VBA code we’ll introduce.
Remember to always maintain a backup of your original data for safety.
Capturing Essential Information
For the VBA code to function correctly, capture the following details:
Sheet Name
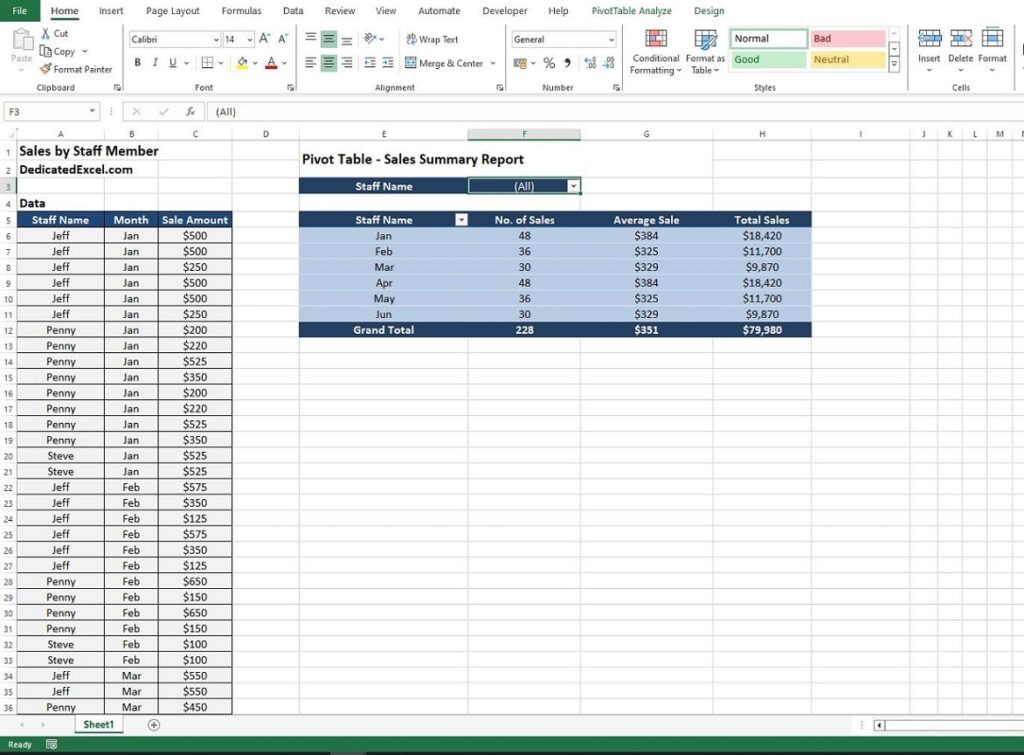
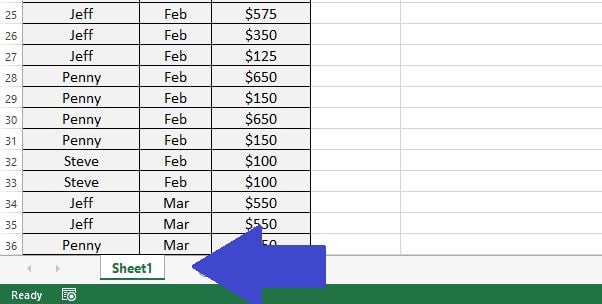
Identify the name of the sheet containing your Pivot Table, like “Sheet1.” This name is crucial for directing the VBA code to the correct location.
Pivot Table Name
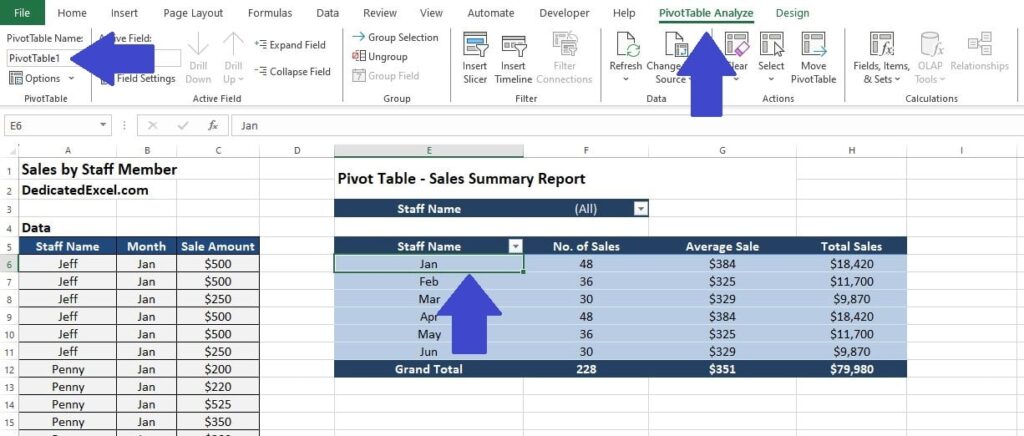
Find your Pivot Table’s name under ‘PivotTable Analyze‘ in the ribbon. First click on a cell within the Pivot Table, select ‘PivotTable Analyze‘ in the ribbon and the ‘PivotTable Name‘ can be found on the left side of the ribbon. This unique identifier is key to targeting the right table in your VBA script.
Note: If you want to change your ‘PivotTable Name‘ you can do so by overwriting the text in the ‘PivotTable Name‘ box.
Pivot Table Field Name
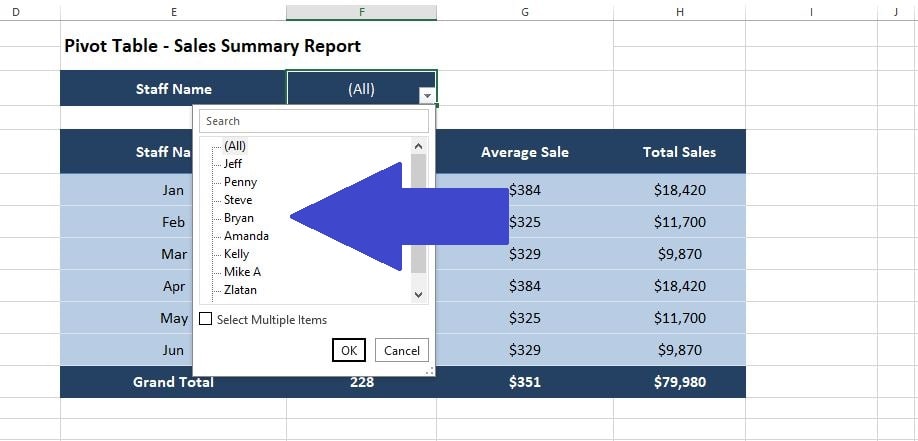
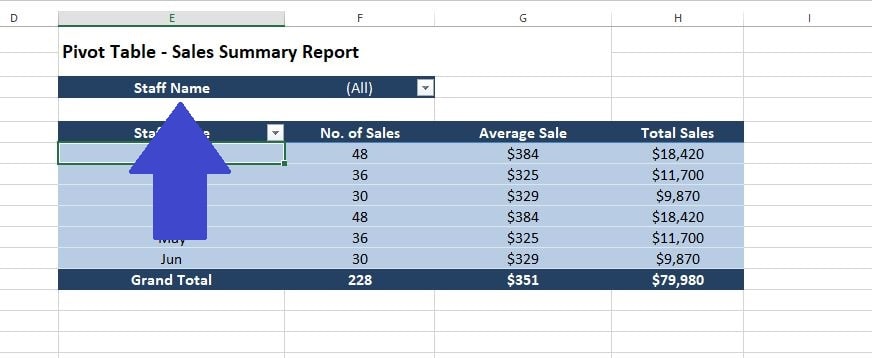
Decide on the field name to split your reports by. In our sales example, this could be “Staff Name.” This field is the cornerstone of dividing your data into individual reports.
VBA Code
Now we need to add some advanced VBA code.
Sub CopyPivDataTotal()
    Dim PT As PivotTable
    Dim PI As PivotItem
    Dim NewWs As Worksheet
    Dim MyField As String
    Dim MySheet As String

    ' User-defined variables
    MySheet = "Sheet1"           ' Define the sheet name where the PIVOT table is located
    Dim MyPIV As String
    MyPIV = "PivotTable1"        ' Define the Pivot table name/number
    MyField = "Staff Name"       ' Define the Field Name for breaking out by

    ' Set reference to the PivotTable
    On Error Resume Next
    Set PT = ThisWorkbook.Sheets(MySheet).PivotTables(MyPIV)
    On Error GoTo 0

    ' Check if the PivotTable exists
    If PT Is Nothing Then
        MsgBox "PivotTable '" & MyPIV & "' not found on the sheet '" & MySheet & "'.", vbExclamation
        Exit Sub
    End If

    ' Loop through each PivotItem in the specified field
    For Each PI In PT.PivotFields(MyField).PivotItems
        PI.Visible = True

        ' Create a new worksheet and copy data
        Set NewWs = ThisWorkbook.Sheets.Add
        NewWs.Name = PI.Name

        ' Filter the PivotTable for the current PivotItem (Staff Name)
        PT.PivotFields(MyField).CurrentPage = PI.Name

        ' Copy the visible data from the PivotTable (excluding headers)
        PT.TableRange2.Copy
        NewWs.Cells(1, 1).PasteSpecial xlPasteValues

        ' Clear the filter to prepare for the next PivotItem
        PT.PivotFields(MyField).ClearAllFilters
    Next PI

    ' Activate the original worksheet
    ThisWorkbook.Sheets(MySheet).Activate
End Sub
Inserting the VBA Code
To insert this code:
- Press ALT + F11 to open the VBA Editor.
- Right-click on your workbook name in the “Project-VBAProject” pane.
- Insert a new module and paste the code into this module.
- Make your changes to the ‘User-defined variables‘ section. Update ‘MySheet‘ with your Sheet Name, ‘MyPIV‘ with your Pivot Table Name and ‘MyField‘ with your dividing Field Name.
Running the VBA Code
Once you’ve successfully inserted the VBA code into your Excel workbook, the next crucial step is to run it. Running the code is straightforward and will automatically execute the process of splitting an Excel Pivot Table into multiple reports. Here’s how to do it:
- Save Your Workbook: Before running the code, ensure that your workbook is saved, preferably as a macro-enabled workbook (‘.xlsm’). This step is crucial for preserving your current work and ensuring that the macros can run properly.
- Access the VBA Editor: If you’re not already in the VBA Editor, press ALT + F11 to open it.
- Locate Your Macro: In the VBA Editor, find the macro you’ve inserted under the Modules folder in the Project Explorer window. The macro will be named based on the sub-procedure in your VBA code, such as Sub CopyPivDataTotal().
- Run the Macro: You can run the macro in a few ways:
- Click on the macro name, and then press F5 to run it.
- From the menu, choose ‘Run‘ and then ‘Run Sub/UserForm‘.
- If you’ve assigned the macro to a button in your Excel sheet, you can simply click this button.
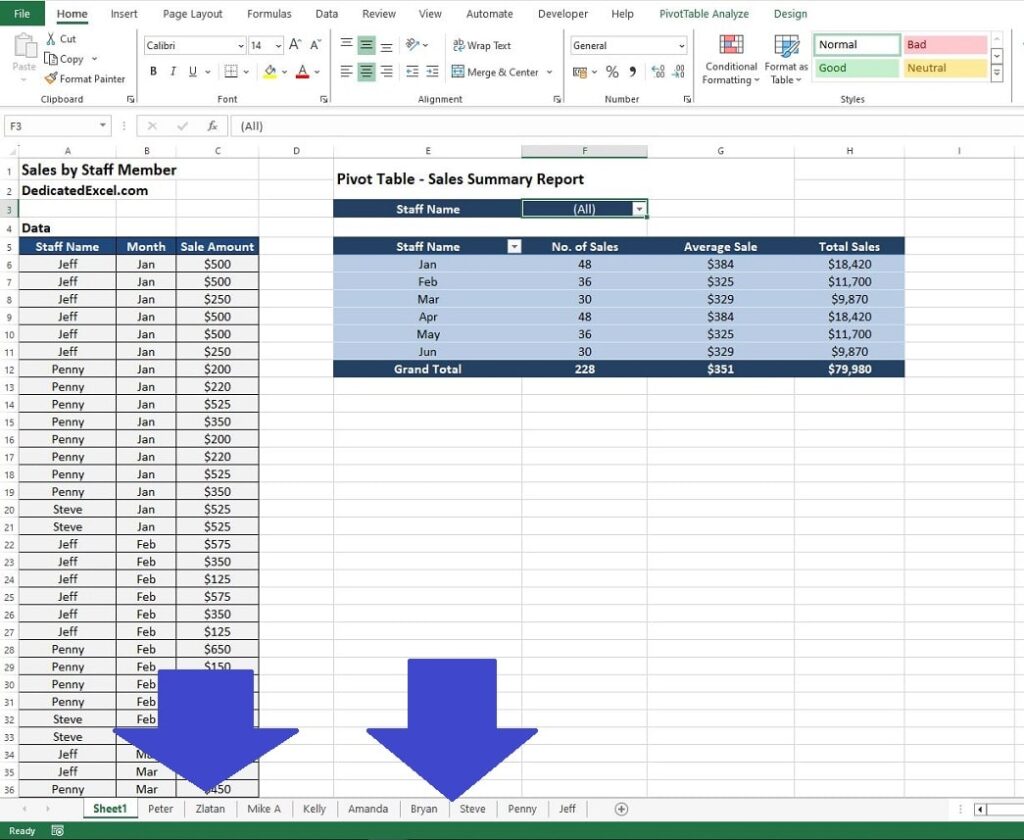
- Monitor the Process: As the macro runs, you’ll notice new tabs (sheets) being added to your workbook, each representing a separate report based on your Pivot Table data.
After Running the Code
- Review Each Report: It’s important to manually check each generated report for accuracy and completeness.
- Save Your Workbook Again: Once you’re satisfied with the reports, save your workbook again to retain the new sheets and data
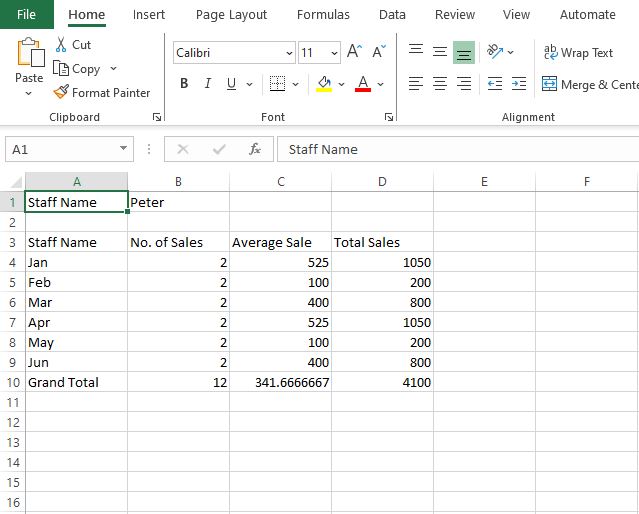
- Check the Results: After the macro has finished running, navigate through the newly created sheets to verify that each report contains the correct filtered data.
What the VBA Code does
This code systematically creates individual reports from your Pivot Table. Here’s a breakdown of its functionality:
- It first identifies and sets a reference to your Pivot Table based on the names you’ve captured.
- The code then loops through each item in your chosen field (e.g., “Staff Name“).
- For each item, it filters the Pivot Table and creates a new worksheet, transferring the filtered data there.
- The process repeats for each unique item, ensuring all data is covered.
Considerations
Running this VBA script to divide your Excel Pivot Table into multiple reports is a powerful technique, but it’s essential to be mindful of several key considerations to ensure a smooth and successful execution:
- Enable Macro Execution: Before you start, make sure that your Excel settings permit the running of macros. You can adjust this in the Trust Centre settings. Enabling macros is crucial for the script to function as intended.
- Accuracy of Names: Pay close attention to the details. Double-check the names you’ve captured – the sheet name, Pivot Table name, and field names. These must be exact for the VBA script to correctly identify and manipulate your data. Accuracy here is vital for the successful splitting of your Excel Pivot Table into multiple reports.
- Impact on Workbook Size and Performance: Be prepared for the script to add multiple new sheets to your workbook. Each sheet will contain a segment of your Pivot Table, split as per your specified field. While this is beneficial for detailed analysis, it can increase the size of your Excel workbook, which may impact performance. Larger workbooks might take longer to open, save, or update, so consider this if you’re working with particularly extensive data sets.
- Data Integrity: After running the VBA script, it’s wise to review the generated reports for data integrity. Ensure each report accurately reflects the corresponding data segment from the original Pivot Table. This verification step is crucial to maintain the reliability of your data analysis.
- Backup Your Data: As with any operation that significantly alters your data, it’s prudent to keep a backup of your original Excel file. This precaution allows you to revert to the original data if anything unexpected occurs during the process of splitting your Excel Pivot Table into multiple reports.
Summary
This guide has walked you through the steps and code necessary for splitting an Excel Pivot Table into multiple reports. By following these instructions and understanding the behind-the-scenes workings of the VBA script, you can efficiently produce individual reports from complex data sets.
Embrace this technique to enhance your data analysis capabilities in Excel, and remember – with the right tools and knowledge, even the most daunting data tasks become manageable.
Keep Excelling,

Next-Level Excel Skills: Keep Your Data Fresh Automatically
You’ve just mastered splitting an Excel Pivot Table into multiple reports. But what if I told you there’s a way to make your Pivot Tables update themselves automatically? Imagine the time you’d save and the efficiency you’d gain. If this sounds like a game-changer, you won’t want to miss our next guide: “How to Make an Excel Pivot Table Update Automatically“.