Grasping how to calculate average in Excel is a fundamental skill for efficient data analysis. Whether you’re in a large multinational corporation managing project timelines or in a small business tracking client job times, Excel offers a straightforward yet powerful way to manage and analyse numerical data.
In this guide, we’ll dive into the essentials of using Excel’s average function, ensuring you can swiftly and accurately handle these calculations in your everyday work
Introduction
Understanding how to calculate average in Excel is a vital skill for anyone beginning their journey in data analysis. An average, simply put, is the sum of a set of numbers divided by the count of those numbers.
For example, to find the average age in a group of three people aged 30, 40, and 50, you add their ages (30 + 40 + 50 = 120) and divide by 3, resulting in an average age of 40.
This concept is not only fundamental in mathematics but also incredibly useful in Excel for analysing and summarizing data sets in various professional contexts.
Average in Excel
Calculating averages in Excel is a game-changer, especially with large datasets. Unlike the simple example of averaging the ages of three people, Excel effortlessly handles vast amounts of data. Imagine calculating the average age of 50,000 individuals! Excel simplifies this otherwise tedious task.
The AVERAGE function in Excel, formatted as
- =AVERAGE(number1, number2, number3…)
allows you to include a range of cells in your calculation, making it an indispensable tool for quick and accurate data analysis.
Example
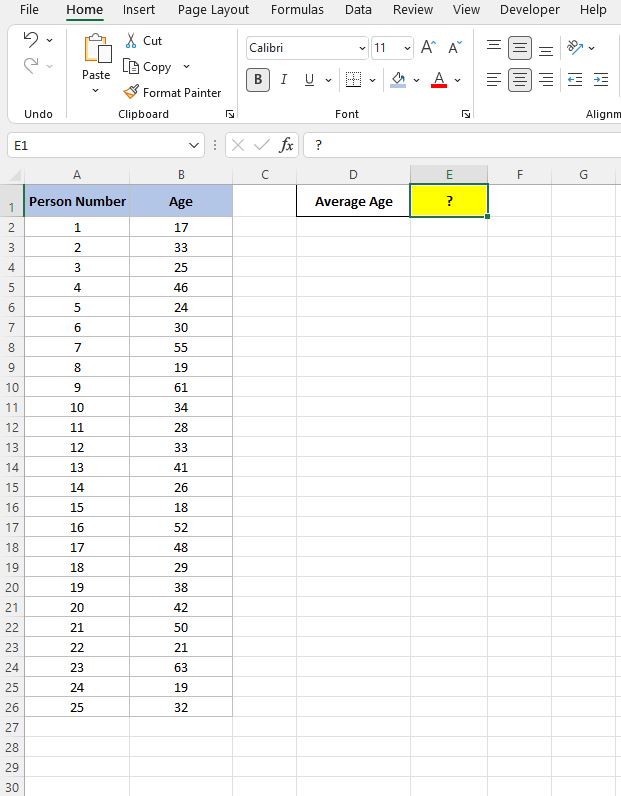
In the below worksheet example there are 25 people along with their Age, which is captured in column B.
The ‘Ages’ can be found in the cells B2 to B26 and we want to calculate the average age of those 25 people with the result in cell E1:

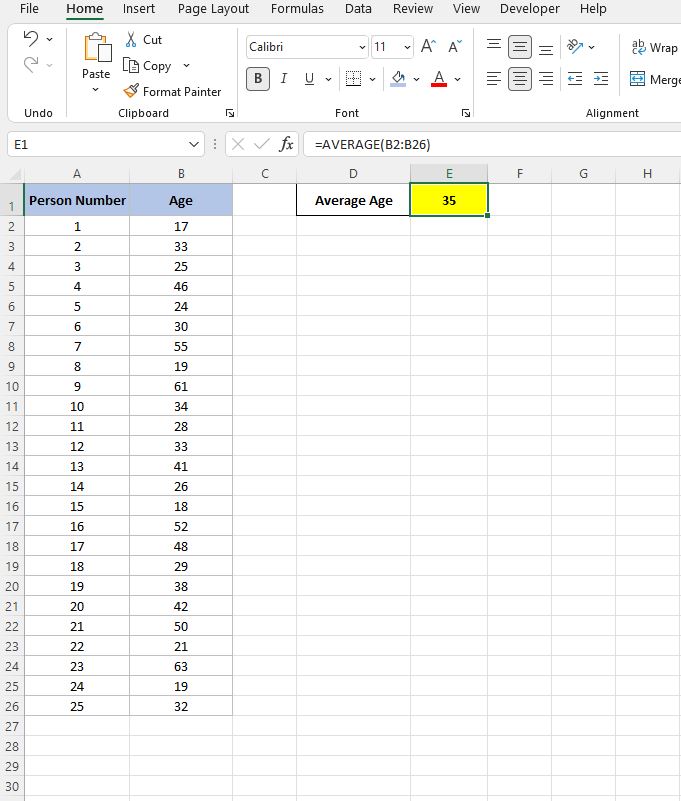
Using the AVERAGE function in Excel we can write the formula in cell E1 to get the desired result:
- = AVERAGE (B2:B26)

So for the 25 people listed in this Excel file the average age is 35 and with the power of Excel that took us less than a few seconds to work out.
Remember averages can only be used on numerical data so if there is any text or character data in your range that record will be ignored.
Summary
As we conclude our exploration, the ability to calculate average in Excel emerges as a crucial skill for any data analyst. This proficiency is not just about applying a formula; it involves a keen understanding of the data at hand. Selecting the right data range and choosing the appropriate average type (mean, median, or mode) are critical steps that ensure the accuracy and relevance of your analysis.
The function to calculate average in Excel is incredibly versatile, suitable for both small and large datasets. It is a fundamental tool that significantly boosts your data handling capabilities, allowing for more insightful and dependable interpretations.
In essence, mastering how to calculate average in Excel is not only about enhancing your technical skills but also about deepening your overall analytical acumen, making it an indispensable part of your Excel toolkit.
Got the hang of averages in Excel? Awesome! Next up: bring a fresh twist to your data displays. Check out ‘How to Create an Excel Chart with a Scroll Bar‘ – it’s your turn to make spreadsheets not just smart, but interactive and engaging. Let’s keep the Excel adventure exciting!


