
Have you have ever wondered what investing $100 every month into Bitcoin, for the past 5 years, would now be worth? How about a weekly investment of $25 into buying Google shares for the last 10 years? If you have then this free Excel Dollar Cost Averaging Calculator can show you the answer in a second, it even compares the performance of the investment against the S&P 500 to provide a useful comparison.

Table of Contents
- What is Dollar Cost Averaging?
- Why is Dollar Cost Averaging Useful?
- What Does the Excel Dollar Cost Averaging Calculator do?
- Requirements for the Excel Dollar Cost Averaging Calculator tool
- How to Update the Input Cells
- How to Interpret the Results
- Download the Excel Dollar Cost Averaging Calculator
- Disclaimer
What is Dollar Cost Averaging?
The term Dollar Cost Averaging (DCA) is an investment strategy where a person regularly invests a fixed amount of money into a particular investment, regardless of its price. By doing so, the theory is investors buy more shares when prices are low and fewer shares when prices are high, which can lead to a lower average cost per share over time.
Not US based? You can replace the word “Dollar” for “British Pounds”, “Euros”, “Yen” or even “Bitcoin”, the strategy is the same! You invest a fixed amount over time into the same financial investment, i.e. Microsoft stock.
Why is Dollar Cost Averaging Useful?
Using a DCA strategy can help mitigate the risk of making large or long-term investments.
For example if you have $1200 to invest you could put all of it into Microsoft stock tomorrow, but that exposes you to the risk of timing the market incorrectly and the entire $1200 could take a hit if the market collapsed a few weeks later.
Alternatively, a less risky approach is to DCA into the investment and buy $100 of Microsoft stock each month for the next 12 months. By doing so you still end up investing the full $1200 but instead of trying to time the market you will average into the investment and hopefully achieve a lower average cost price for your shares.
This type of investing is used both by professional and retail investors and is especially practical for those wanting to invest in shares or cryptocurrencies without taking market timing risks.
What Does the Excel Dollar Cost Averaging Calculator do?
The Excel Dollar Cost Averaging Calculator allows you to evaluate the performance of Dollar Cost Averaging into an investment. To perform an analysis of a stock or cryptocurrency:
- Enter a stock ticker, or cryptocurrency ticker.
- Enter a time frame to analyse using the start and end dates.
- Select a payment frequency by choosing from Daily, Weekly or Monthly.
- Enter the payment amount, i.e. 100.
- Click Refresh.
The file will update almost instantly with the results. You will be able to see how much you would have invested, how that investment would have performed and even see how the investment compared to the S&P 500 for the same time frame.
Requirements for the Excel Dollar Cost Averaging Calculator tool
The requirements for the Excel Dollar Cost Averaging tool are:
- Excel 2019 or Excel 365 only. This file utilises Excels StockHistory function and Stocks Data Type, both of which are unavailable in prior versions of Excel.
- You must Enable Macros for this file. The file contains VBA, this is used to refresh the stock price history and update the summary table information.
How to Update the Input Cells
To perform a DCA analysis update the 5 input cells:
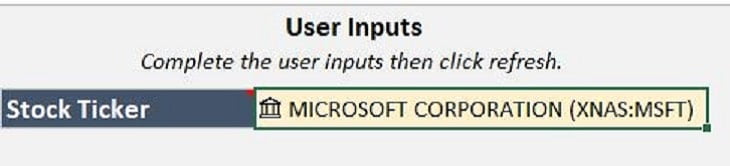
- Stock Ticker – Input the ticker symbol for the stock, or cryptocurrency, to analyse. For example AAPL is the ticker symbol for Apple or BTCUSD is the Bitcoin USD price. If you don’t know the symbol you can look it up on sites like yahoo finance, or you can try typing the company name into the input box to see if Excel can match it. A good match is when the Stocks Data Type icon is shown next to the company name.
A non-match is when a question mark is shown next to the name.
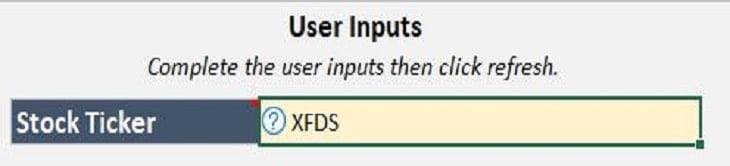
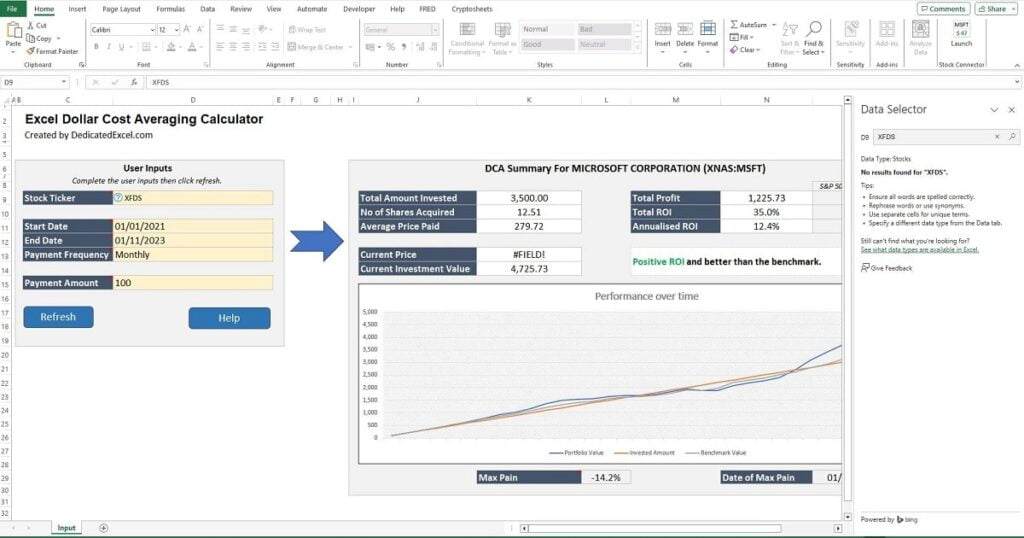
To fix the non-match either look up the correct symbol and re-enter or click on the question-mark icon and try to find and select the correct company using the Data Selector box that appears in the Excel window on the far right side:
2. Start Date – Input the start date for the analysis. The file was created using a DD/MM/YYYY date format but Excel should update to your local settings. If you notice any problems and are using a US date format please try with the UK date format and see if it resolves the issue. There is no official documentation on start dates for each stock or financial instrument available using Excels StockHistory function. Some companies, especially major ones, have data going back 20+ years, but others may not have as much information available so be aware of this when selecting older start dates.
3. End Date – Input the end date for the analysis. As with the start date.
4. Payment Frequency. This is a drop down list where you can select either Daily, Weekly or Monthly. For most situations a monthly payment is suitable.
5. Payment Amount. This is the amount of each payment so if you want to invest $100 per month you would select a frequency of monthly and the amount would be 100. There is no need for currency symbols as the file avoids their use so readers from different countries can take advantage of the tool.
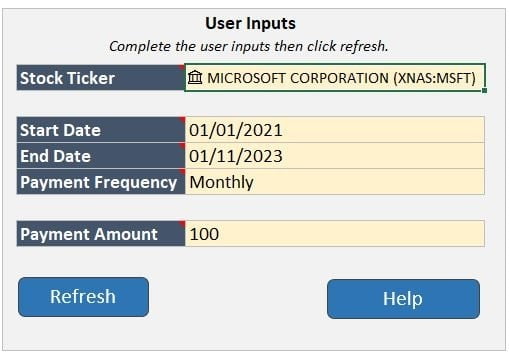
With all the input fields updated click the Refresh button below them and the information and chart in the Summary section will update. A user message will pop up to inform you the process is complete. Note the Excel Dollar Cost Averaging tool overwrites any previous data when a refresh is actioned, there is no need to manually clear old data.
How to Interpret the Results
The results of the Excel Dollar Cost Averaging tool are shown in a Summary, found on the right side of the worksheet. There are key stats to help determine the performance of the investment, along with comparing it to the benchmark S&P 500, and a chart illustrating how the investment has performed over time.
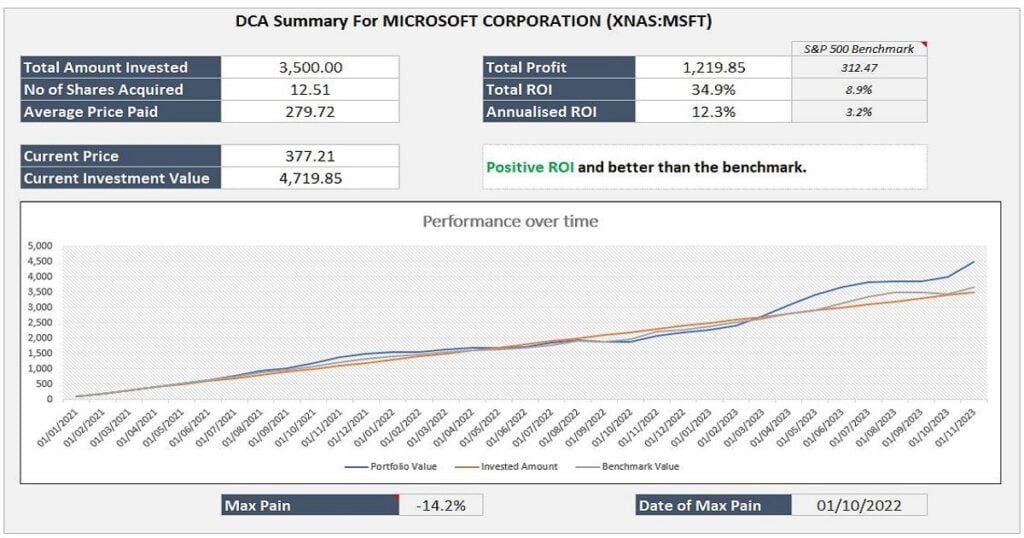
The stats shown are as follows:
- Total Amount Invested – This is the total invest over the timeframe supplied. For example 12 months of $100 paid monthly would mean a Total Invested Amount of $1200.
- No of Shares Acquired – This shows the total number of shares acquired during the time frame. This is calculated based on the payment amount, frequency and the number of shares you theoretically would have purchased at the time. Note that for analysis purposes the model assumes you can buy fractional shares and when purchasing shares the mid-price of that day is used.
- Average Price Paid – This is the average cost base and calculated by the Total Amount Invested divided by the Number of Shares Acquired.
- Current Price – The current price of the stock or cryptocurrency analysed.
- Current Investment Value – This is the current value of the investment, calculated by the Current Price * Number of Shares Acquired.
- Total Profit – This shows the overall profit, or loss, from the investment.
- Total ROI – This is the return on investment and calculated by Total Profit / Total Amount Invested.
- Annualised ROI – The is the ROI annualised over the timeframe selected. This figure provides a clearer understanding of how well the investment performs year-by-year.
- Max Pain – This figures shows the point of worst performance for the investment. For example the Total ROI might be 20% but the Max Pain could be -40%, this means at a point in time your investment was down 40%. Would you have sold out early and missed the rebound?
- Max Pain Date – This is corresponding date of the Max Pain point.
Note that Total Profit, Total ROI and Annualised ROI are published side-by-side with the benchmark of the S&P 500 for the same period. This helps to determine whether the investment was better, or worse, than the market average. Another important note is that Dividends are not included in this analysis, please factor that in when reviewing the results if the company you are analysing pays one.
Download the Excel Dollar Cost Averaging Calculator
Download Free Excel Dollar Cost Averaging Calculator HereDisclaimer
Finally please note this is not a tool aimed at providing financial advice, it merely showcases features of the Microsoft Excel software package. The free dollar cost averaging calculator in Excel relies on external data sources for prices and performs various calculations, none of which have been independently validated. Please consult a qualified financial advisor before making any investments. This file may not be published on other websites or file sharing services without written consent from the owner.
Keep Excelling,

Just like mastering investments with our DCA tool, successful project management hinges on clear visualization. Ready to level up your skills? Check out our quick guide on ‘How to Create a Gantt Chart in Excel‘ – your next step towards Excel excellence.