
Welcome to the world of Excel charts! Whether you’re a novice or just looking to refresh your skills, this guide will provide an in-depth look at all the chart types in Excel. We’ll cover their purpose, tips for using and a real-world example so you’ll confidently navigate the choices, ensuring you always select the right chart for your data analysis needs.
Table of Contents
Why Excel Charts Matter
Charts in Excel are not just about visual appeal; they turn data into insightful stories. By visualizing data, charts help identify trends, make comparisons, and provide a clear understanding of complex information.
When faced with a spreadsheet full of data, it’s often challenging to make sense of what the numbers are trying to convey. This is where Excel charts come into play. They take this raw data and turn it into a form that’s easy to understand and interpret.
For instance, a line chart can illustrate how sales figures have fluctuated over a year, clearly showing peaks and troughs that might be missed in a standard table.
Similarly, a pie chart can instantly show the proportion of different products contributing to total sales, something that could take much longer to comprehend when looking at numbers alone.
The Art of Using Excel Charts
Choosing the right chart is critical. A well-selected chart can illuminate data, while a poorly chosen one can obscure its meaning. Always consider what you want your chart to communicate.
For novices, the art of using Excel charts effectively lies in asking the right questions:
What story do you want your data to tell? Are you comparing values, showing a trend over time, highlighting a distribution, or demonstrating a relationship between variables?
The answers to these questions will guide you in choosing the most suitable chart type.
Comprehensive Look at Excel Chart Types
Now, let’s take a closer look at the wide range of Excel charts available and explore what each one has to offer:
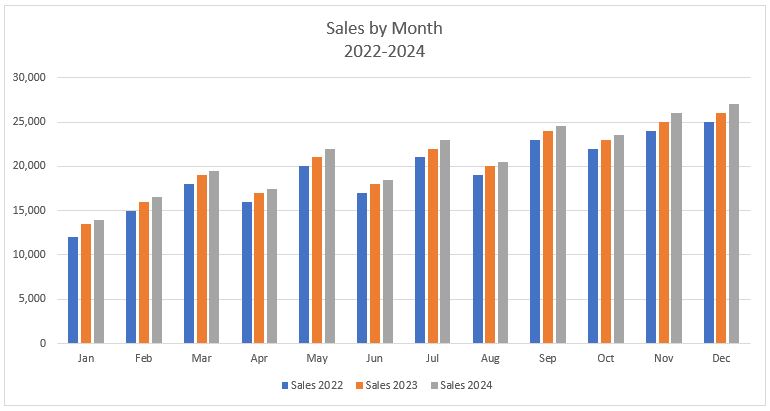
Column Chart
- Purpose: Ideal for comparing values across categories.
- Details: Visualizes data in vertical bars, making it easy to compare different groups.
- Tips: Use distinct colours for clarity and avoid overcrowding with data.
- Real-World Example: Comparing monthly sales figures across different years. It clearly shows which months performed better or worse, helping in identifying seasonal trends.
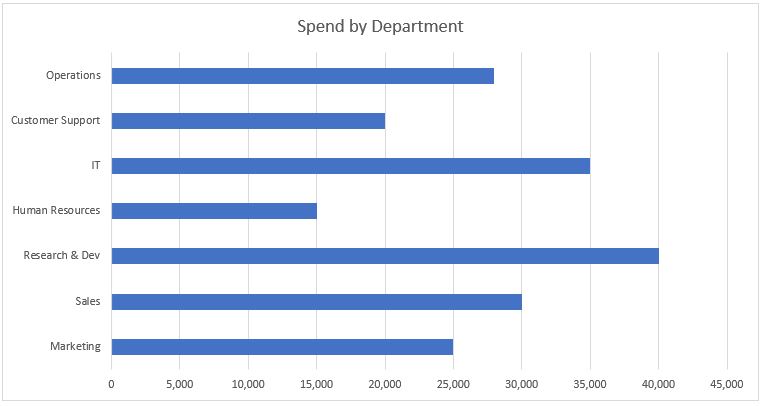
Bar Chart
- Purpose: Best for comparing quantities among different groups.
- Details: Similar to column charts but horizontal, offering a straightforward comparison.
- Tips: Use gradient or contrasting colours for different categories.
- Real-World Example: Showing different departments’ spending in a company. It’s ideal for comparing discrete values like budget allocations or expenses.
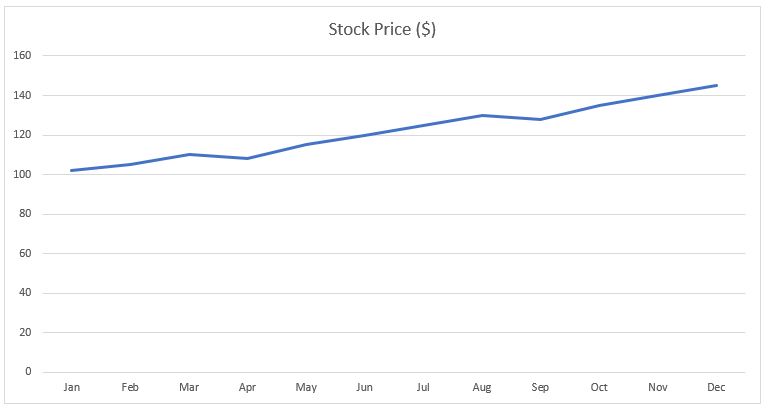
Line Chart
- Purpose: Excellent for showing trends and changes over time.
- Details: Points are connected by lines, making trend observation intuitive.
- Tips: Limit line numbers to maintain clarity. Highlight important data points if necessary.
- Real-World Example: Tracking stock market price changes over time. It’s perfect for displaying continuous data, like financial trends.
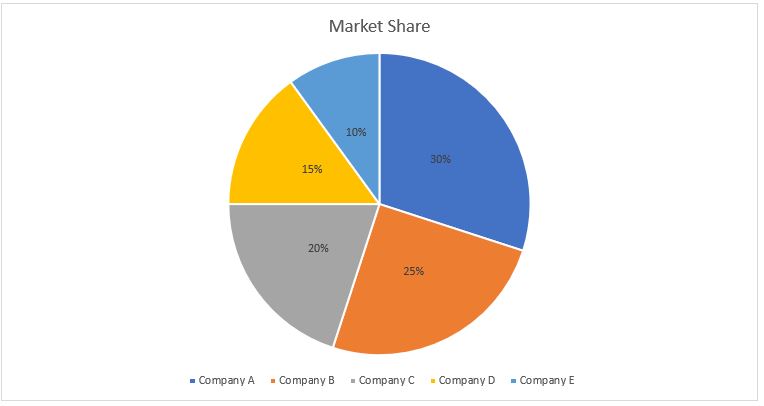
Pie Chart
- Purpose: Illustrates the proportions of a whole.
- Details: Each slice represents a part of the total, ideal for percentage distribution.
- Tips: Use contrasting colours for slices and limit the number for clarity.
- Real-World Example: Displaying market share of different companies in an industry. It gives a quick view of each company’s relative size in the market.
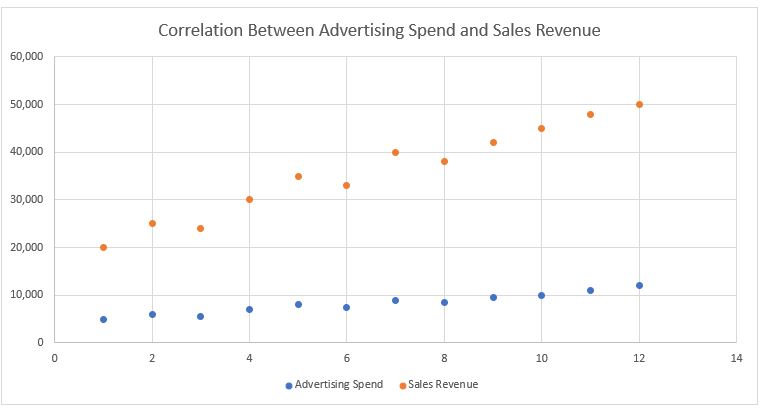
XY (Scatter) Chart
- Purpose: Shows the relationship between two variables.
- Details: Data points are plotted on two axes, revealing patterns or correlations.
- Tips: Use trendlines for clear correlation demonstration. Avoid over-plotting.
- Real-World Example: Analysing the correlation between advertising spend and sales revenue. It helps in understanding if increased advertising leads to proportional sales increases.
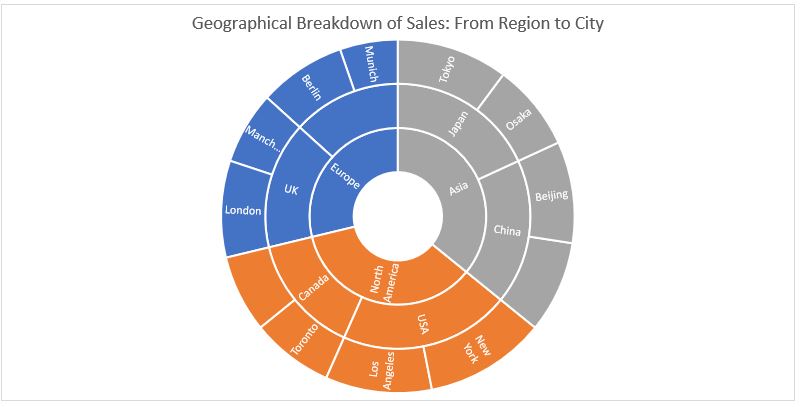
Sunburst Chart
- Purpose: Displays hierarchical data in a multi-level pie chart.
- Details: Each ring represents a deeper level of the hierarchy, suitable for nested data.
- Tips: Use colour coding for different levels for easier interpretation.
- Real-World Example: Breaking down sales data by region, then by country, then by city. It visually segments data in an intuitive, nested manner.
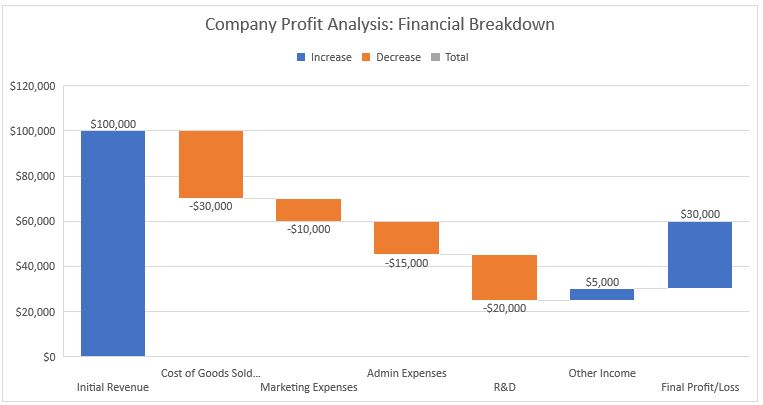
Waterfall Chart
- Purpose: Ideal for demonstrating how initial values are affected by intermediate positive or negative values.
- Details: Commonly used for financial statements, showing a starting value altered by a series of values.
- Tips: Use contrasting colours for increases and decreases.
- Real-World Example: Understanding a company’s profit progression. It can show how revenue and various costs contribute to the final profit or loss.
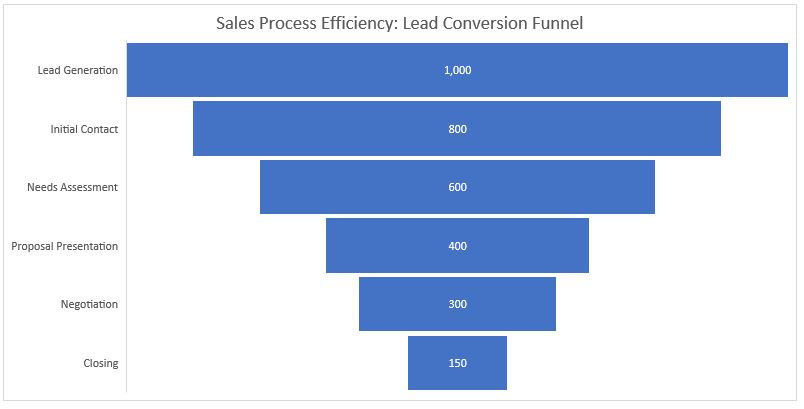
Funnel Chart
- Purpose: Useful for representing stages in a process.
- Details: Visualizes progressive reduction or expansion stages, like sales funnels.
- Tips: Use gradient colours to represent different stages of the funnel.
- Real-World Example: Tracking the stages of a sales process from lead generation to closing. It helps in identifying potential drop-off points.
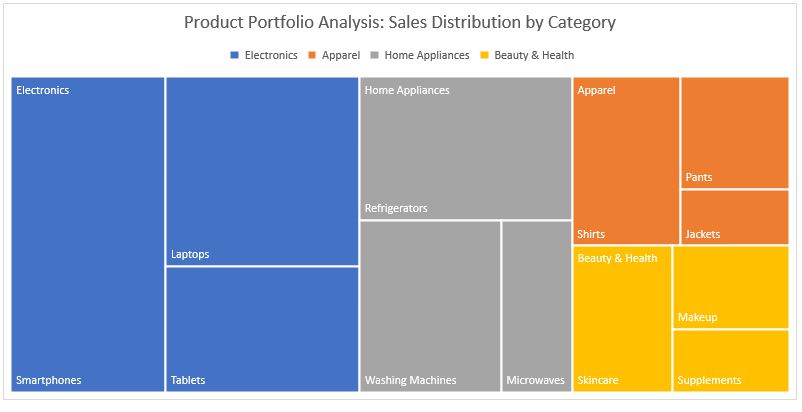
Treemap Chart
- Purpose: Effective for displaying large amounts of hierarchical data.
- Details: Rectangles represent different levels of hierarchy, nested within each other.
- Tips: Use colour coding to differentiate between hierarchies.
- Real-World Example: Analysing a company’s product portfolio. It can illustrate product categories and their contributions to total sales.
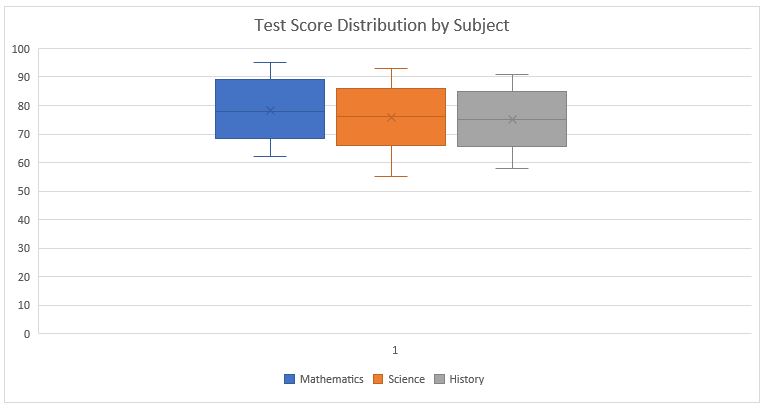
Box and Whisker Chart
- Purpose: Ideal for statistical analysis, showing the distribution of a dataset.
- Details: Displays the median, quartiles, and outliers within a dataset.
- Tips: Focus on interpreting the quartiles and median for distribution analysis, and use this chart to easily identify outliers in your data.
- Real-World Example: Analysing the range of test scores in different subjects to identify variations and outliers.
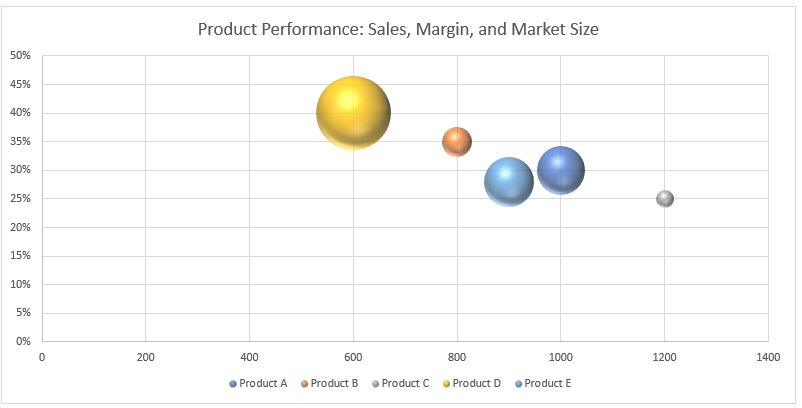
Bubble Chart
- Purpose: Useful for displaying three dimensions of data.
- Details: Combines x-y scatter plots with the size of the bubbles representing the third dimension.
- Tips: Ensure bubble sizes accurately reflect the data, use colours for clarity, and avoid cluttering to maintain readability.
- Real-World Example: Comparing the sales volume, profit margin, and market size of different products.
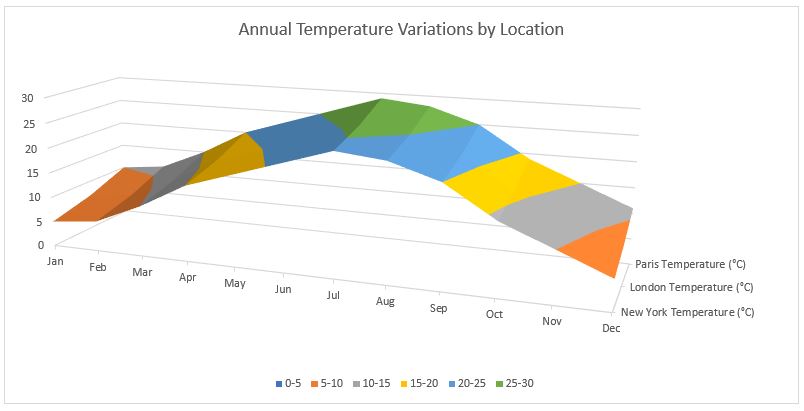
Surface Chart
- Purpose: Ideal for finding optimum combinations between two sets of data.
- Details: Shows trends in values across two dimensions in a continuous surface.
- Tips: Ideal for visualizing three-dimensional continuous data; keep the chart simple to avoid confusion.
- Real-World Example: Analysing geographical temperature variations over a year.
Radar Chart
- Purpose: Comparing multiple variables to show strengths and weaknesses.
- Details: Displays data in a two-dimensional chart of three or more quantitative variables represented on axes starting from the same point.
- Tips: Maintain consistent scaling for each axis and limit the number of variables for clear comparison.
- Real-World Example: Comparing skill assessments across different competencies for two job candidates.

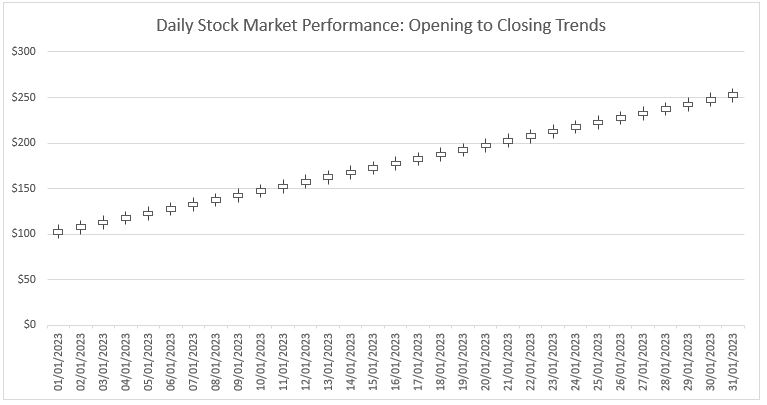
Stock Chart
- Purpose: Ideal for tracking financial market data, particularly the price movements of stocks.
- Details: A Stock Chart in Excel typically shows the opening, high, low, and closing prices of a stock over time. It’s an invaluable tool for investors and analysts to visually interpret market trends and patterns.
- Tips: Ensure data is in chronological order and use the chart to highlight critical stock movements and trends.
- Real-World Example: Monitoring the daily performance of a company’s stock. This type of chart can illustrate how the stock’s price fluctuated within each day and how it opened and closed.
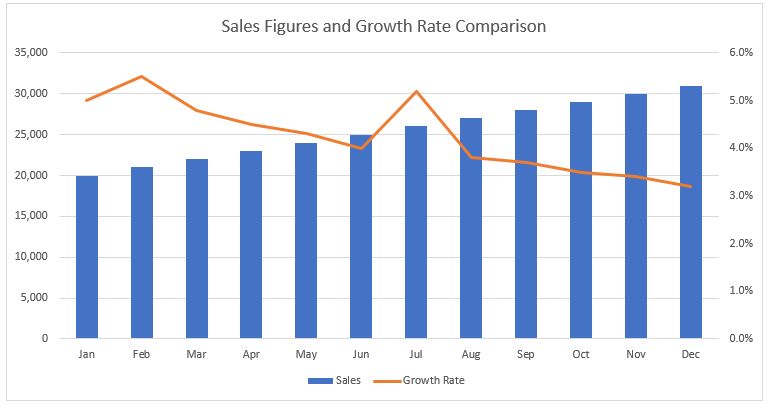
Combo Chart
- Purpose: Combines two or more chart types to make comparisons or show relationships.
- Details: Useful when data has different units or scales of measure.
- Tips: Combine related data sets with distinct visual styles, and balance the chart scales for a clear comparison. For more information on creating a combo chart check our guide on how to create a chart with two y-axis in Excel.
- Real-World Example: Showing sales figures (column chart) alongside the percentage growth rate (line chart).
Charting Best Practices
When working with Excel charts, there are several best practices to consider. These guidelines ensure that your charts are not only visually appealing but also effective in conveying the right information.
Matching the Chart to Your Data Story
When selecting the right type of chart for your data, it’s crucial to ask, “What story am I trying to tell?” For instance, if you’re looking to show progress over time, line or column charts are usually your best bet. They provide a clear view of trends and changes, which is invaluable in scenarios like tracking sales growth or monitoring project timelines. On the other hand, pie charts are excellent for illustrating how different segments contribute to a whole, making them perfect for displaying market share or budget allocation.
Strategic Placement for Maximum Impact
The placement of your chart on the Excel sheet can significantly impact its effectiveness. Research suggests that people often start scanning from the top left of a page, moving towards the right. Therefore, placing a critical chart in the top right corner can ensure it catches the viewer’s attention quickly. For instance, in a business report, you might want your key financial summary chart to be in this prime location, making it the focal point for the reader.
Prioritising Readability with Colour and Style
Colour and style play a vital role in how your chart communicates data. While Excel offers a wide range of styling options, simplicity often leads to better comprehension. For example, using a consistent colour scheme can help in quickly identifying and comparing data series across multiple charts. If you’re presenting sales data from different regions, using distinct but harmonious colours for each region helps in distinguishing them at a glance, while maintaining a professional look.
Enhancing Understanding with Proper Formatting
The way you format your chart can make a significant difference in its clarity and impact. Titles, labels, and legends are more than just decorative elements; they provide essential context. For instance, a well-titled chart with clear axis labels and a legend makes it easy for viewers to understand what the data represents, such as differentiating between projected and actual sales in a sales performance report. Additionally, consider the readability of your charts – font size, label orientation, and the inclusion of data labels can all contribute to how easily your audience can interpret the information.
Summary
In summary, creating effective Excel charts involves thoughtful consideration of the type of chart you use, its placement, and how it is styled and formatted. These elements should work cohesively to tell your data’s story in the most clear and impactful way. By following these best practices, your Excel charts will not only look professional but also serve as powerful tools in data analysis and presentation.
Keep Excelling,

Ready to put your knowledge into practice? Don’t miss our ‘Creating a Chart in Excel‘ guide, where we walk you through the steps of chart-making with ease.