
Encountering the “Excel Stock Chart Error” can be a frustrating roadblock for many users. This guide is crafted to demystify and resolve this common issue, ensuring your stock charts in Excel are error-free and accurately represented.
Stock Chart Error
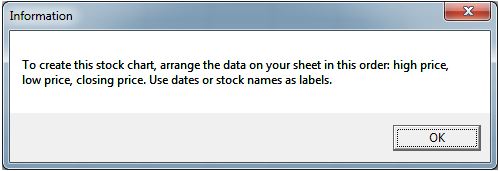
The Excel Stock Chart Error, typically indicated by the message “To create this stock chart, arrange the data on your sheet in this order: high price, low price, closing price. Use dates or stock names as labels,” is a hurdle that many Excel users face.
This post aims to provide clear, step-by-step instructions to help you overcome this error without resorting to downloading fixes or creating custom bar charts.
Key Causes of the Excel Stock Chart Error
Be on the lookout for any issues with the following fields in Excel:
No Date Field
Stock charts in Excel crucially require a date field in a recognizable date format. Attempting to create a stock chart using only stock names or codes without a date will invariably trigger the Excel Stock Chart Error.
Missing Headers
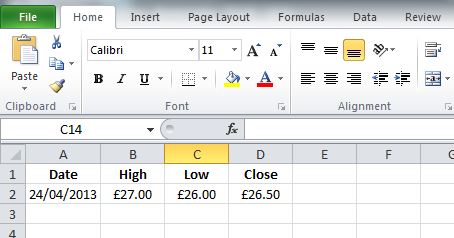
Headers are vital for Excel to recognize and categorize your data correctly. For a basic stock chart, your data should include headers named ‘Date‘, ‘High‘, ‘Low‘, and ‘Close‘.
Incorrect Data Format
Ensure your data is formatted correctly, with dates and numerical values like currency or numbers. While Excel can often interpret text-formatted numbers correctly, it’s always safer to format your data properly to avoid errors.
Inadequate Headers for Selected Stock Chart Type
Different types of stock charts in Excel require specific data elements. Pay close attention to the requirements of the chart you are attempting to create.
For instance, if an ‘Open‘ price is required, ensure to include it along with a corresponding header.
Summary
Creating a stock chart in Excel demands precision in your data setup. Unlike other chart types where Excel might create an inaccurate chart for later correction, stock charts require correct data arrangement from the start.
By adhering to the guidelines above, starting with the most basic stock chart and gradually advancing, you can effectively prevent and resolve the Excel Stock Chart Error.
Keep Excelling,
After mastering stock charts, dive into our latest tool – the Excel Dollar Cost Averaging Calculator. This free DCA tool in Excel simplifies your investment strategy, helping you make informed decisions with ease. Discover how this powerful tool can enhance your financial analysis and investment planning in Excel.