
Data forecasting can often feel like trying to solve a puzzle without all the pieces. It’s a crucial skill for any business looking to stay ahead of the curve, yet it remains a significant challenge for many. Enter Business Assist Forecast, a cutting-edge Excel Add-in powered by AI, designed to transform the way we approach forecasting.
In this post, we’ll uncover how this tool simplifies the forecasting process, making accurate predictions accessible to all.
- Introduction
- Installing Business Assist – Forecast
- How to Use – Chicago Wind Speed Forecast Example
- Are the Forecasts Accurate?
- Alternative Forecasting Options in Excel
- Summary
Introduction
Forecasting is a vital aspect of business planning and decision-making. It involves predicting future trends, demands, and occurrences based on historical data. However, for many, forecasting can be a daunting task, fraught with complexities and uncertainties. This is where Microsoft’s ‘Business Assist – Forecast’ Excel Add-In comes into play, offering a streamlined and efficient solution to forecasting needs.
‘Business Assist – Forecast’ is an AI-powered Excel Add-in. Utilizing advanced machine learning algorithms, it simplifies the process of analysing past trends and volumes, enabling more accurate and confident predictions of future events.
In the following sections, we’ll dive deeper into how ‘Business Assist – Forecast’ works, its key features, and a step-by-step guide to making the most of this innovative Add-in. Whether you’re struggling with the complexities of forecasting or looking to enhance your current methods, ‘Business Assist – Forecast’ offers a promising solution to help you navigate the forecasting landscape with greater ease and accuracy.
Installing the Business Assist – Forecast Add-In for Excel
System Requirements
The first step is to make sure your version of Excel meets the minimum requirements, otherwise you won’t be able to install and use the Add-In. For the Add-In to work you must be running one of the following versions of Excel:
- Excel for the web
- Excel 2013 for Windows
- Excel 2016 for Windows
- Excel for Windows with a Microsoft 365 subscription
- Excel 2015 for Mac
- Excel for Mac with a Microsoft 365 subscription
Installation
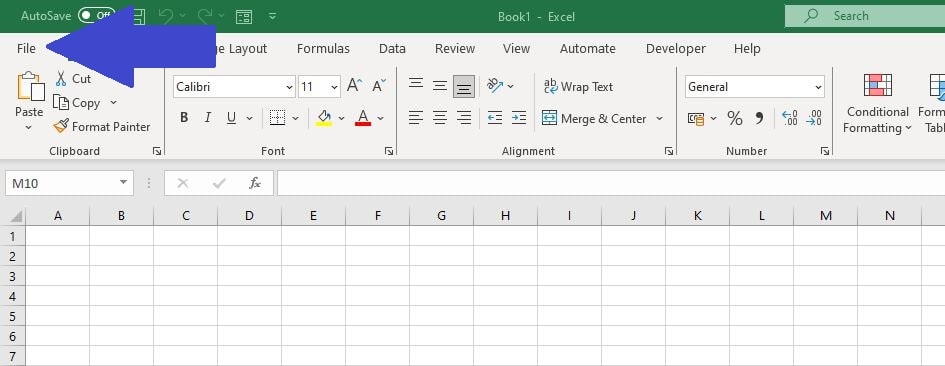
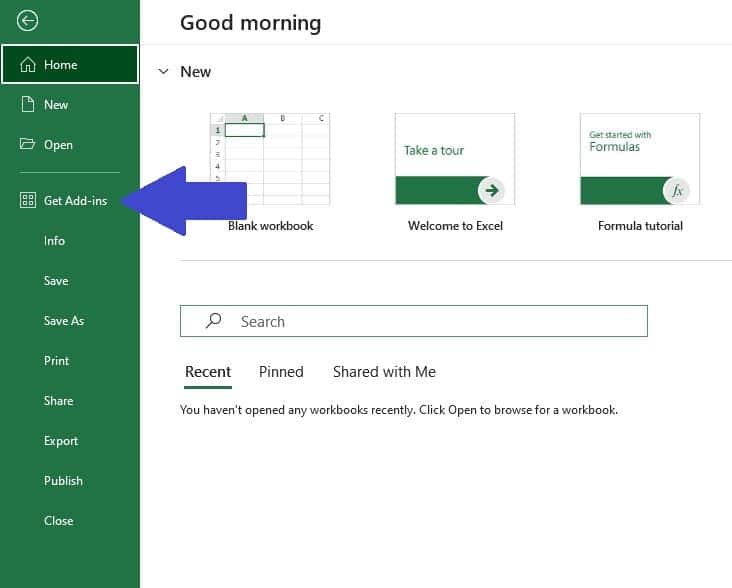
Assuming you’ve good to go the next step is to open up a new Excel workbook. Then on the Excel ribbon click ‘File‘ in the top left which takes you to the Excel’s Home Window. From there click ‘Get Add-ins‘ from the side menu.
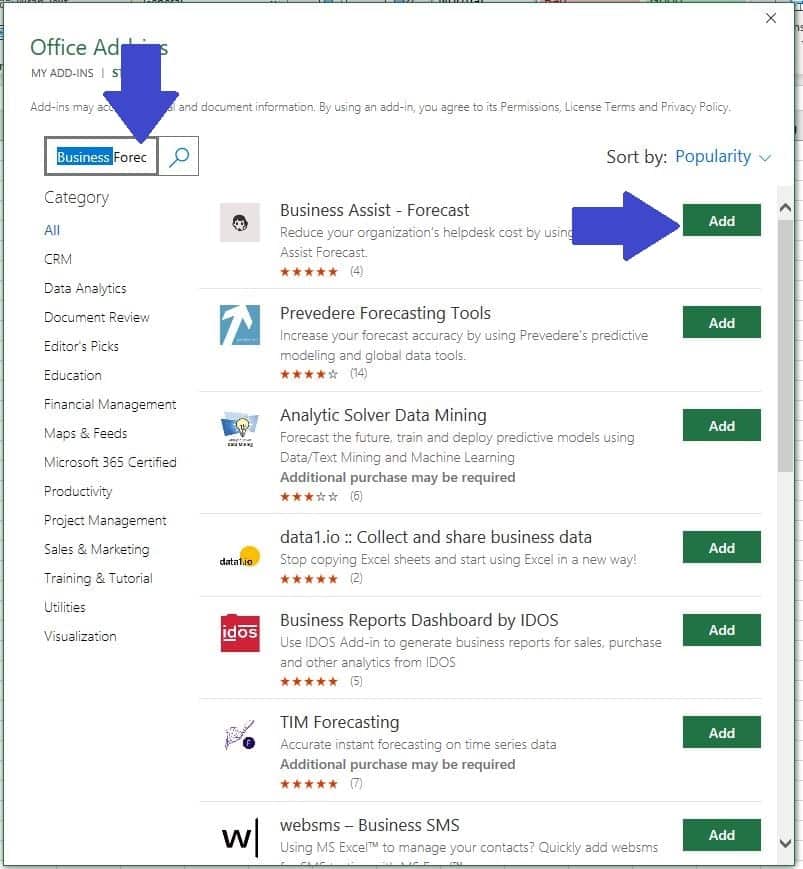
After selecting ‘Get Add-ins‘ you are presented with the Office Add-Ins search box. Type “Business Assist – Forecast” into the search box and click the magnifying glass. The ‘Business Assist – Forecast‘ Add-In will appear at the top, click the green ‘Add‘ button adjacent to it.
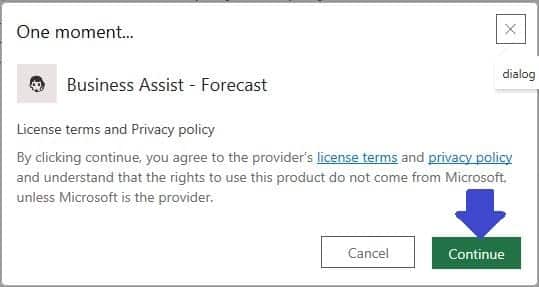
When prompted click ‘Continue‘ (assuming you agree to the terms and privacy policy!)
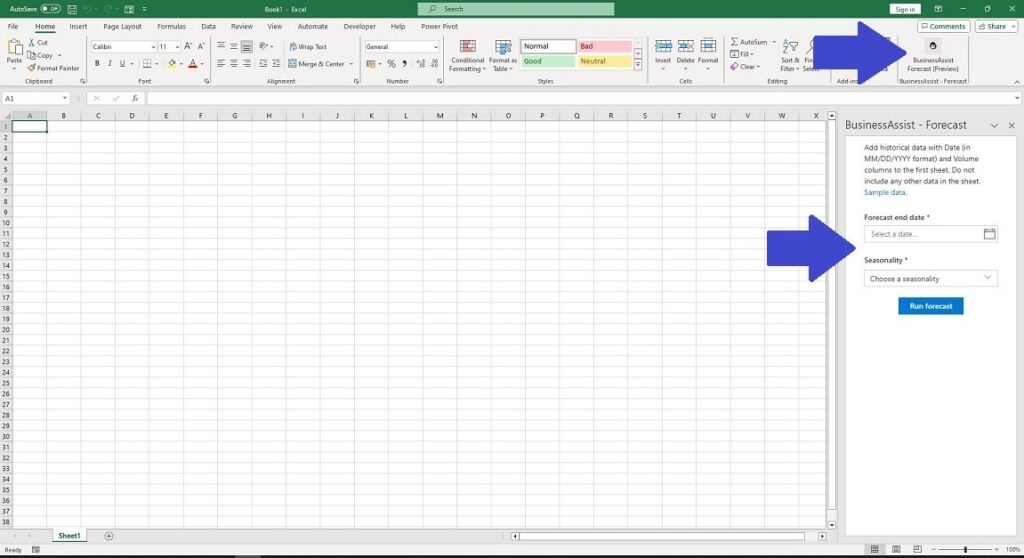
Excel will then go back to your workbook screen. The ‘Business Assist Forecast‘ Add-in will have been added to the Excel ribbon (usually the icon is located on the far right side of the ribbon).
If you click on the Icon you will see the ‘Business Assist Forecast‘ Window confirming that everything has been installed. Note that the Add-in should remain available until you remove it from your Excel account.
Using ‘Business Assist – Forecast’ to Forecast Wind in Chicago
Let’s test the process out and what better way than with some unpredictable weather data! We can use the ‘Business Assist Forecast’ Add-In to forecast the average daily wind speed in the windiest cities of them all, Chicago.
For this forecast we’ll use the past 12 months of actual wind speed data (from 1st December 2022 to 30th November 2023) and use that to forecast the wind speed for December 2023.

You can obtain free weather data like this from the National Oceanic and Atmospheric Administration although please make sure you follow their download rules and limitations. If you would like to follow along with this example I have made the Excel file available for download.
Download Chicago Wind Speed Excel File1. Organize The Data
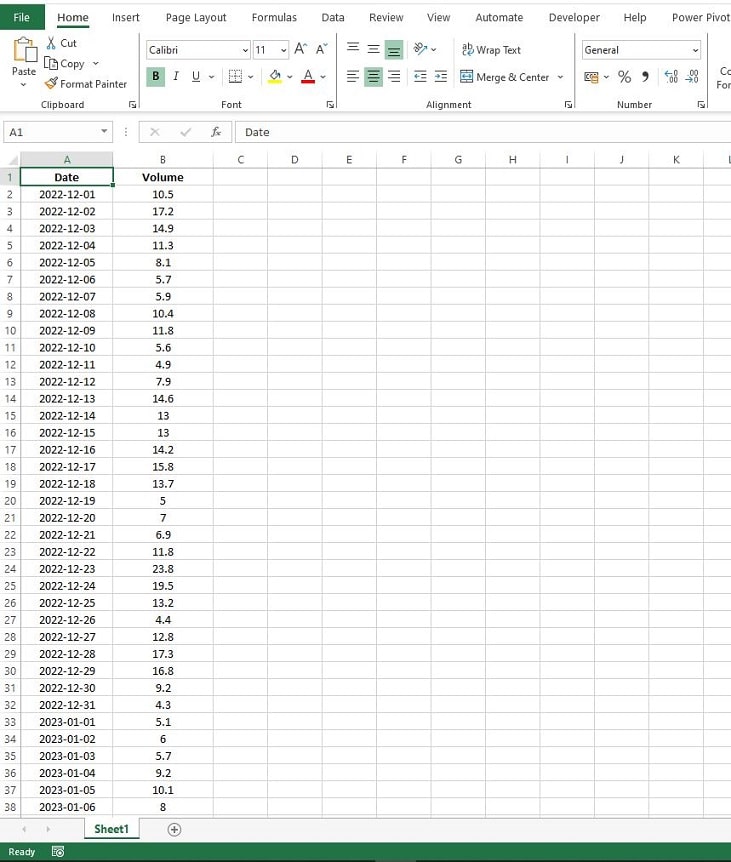
In order to produce a forecast using Business Assist Forecast you must have two (and only two) data fields.
- Date: Dates must be in Column A using the US date format. This means positioning the month before the day—a friendly nod to our European readers! Format dates either as MM-DD-YYYY or MM/DD/YY for clarity and consistency. Make sure cell A1 is labelled “Date“.
- Volume: The forecast requires the volume field in Column B. The volume is the value you are forecasting, for example, share prices, sales volumes or in this case wind speed. Make sure cell B1 is labelled “Volume“.
Note: The tool will not run unless it finds A1 and B1 are labelled “Date” and “Volume” respectively.
2. Running The Forecast
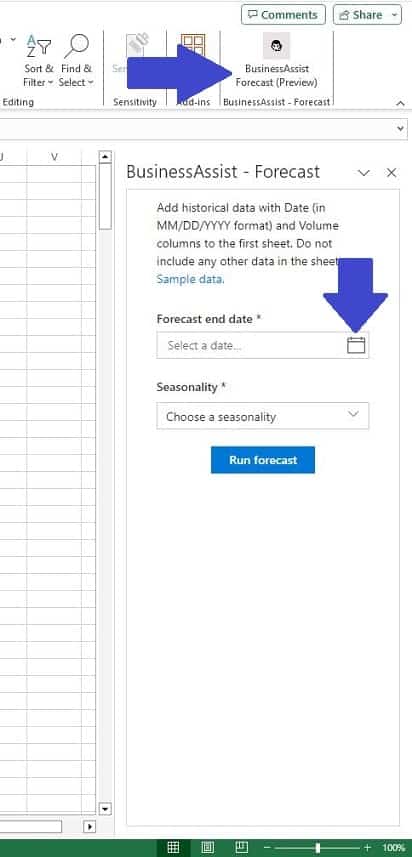
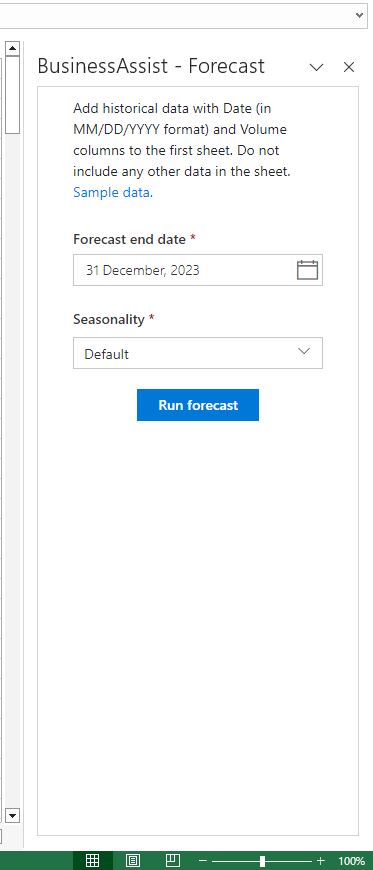
With the data correctly organized the next step is to activate the Business Assist Forecast Add-In. On the Excel ribbon, click the ‘Business Assist Forecast‘ icon to activate the Business Assist Forecast Window.
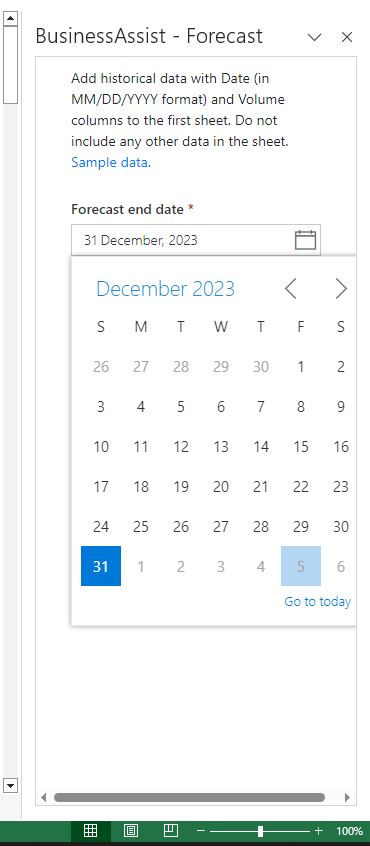
Next we can can choose a period to forecast, for this example we’ll use the data, captured from 1st December 2022 to 30th November 2023, to forecast out to 31st December 2023.
After selecting the date period to forecast we have to choose a seasonality. There are 7 potential options to consider:
- Default: The default option allows the tool to automatically determine the best seasonality based on the data. This can be a good starting point if we’re unsure about any the seasonal patterns in the data.
- Daily: Since we have daily data, this option might seem relevant, but daily seasonality would imply a pattern that repeats every day, which is unlikely for wind speed.
- Weekly: Selecting Weekly could be useful if we notice patterns that repeat every week, such as certain days consistently having higher or lower wind speeds.
- Monthly: This is a strong candidate for wind speed data, as weather patterns often change on a monthly basis due to broader climatic shifts.
- Quarterly: A quarterly seasonality might be less relevant for wind speed unless we notice specific patterns repeating every three months.
- Yearly: This is also a good option to consider, especially for weather-related data. Wind patterns can vary greatly across seasons and years. But we would require more data to make this forecasting appropriate.
- Weekly + Yearly: This combination can be chosen if we observe that wind speeds follow both weekly and yearly patterns. It’s a more complex model and might be suitable if the data shows significant variations on both these time scales.
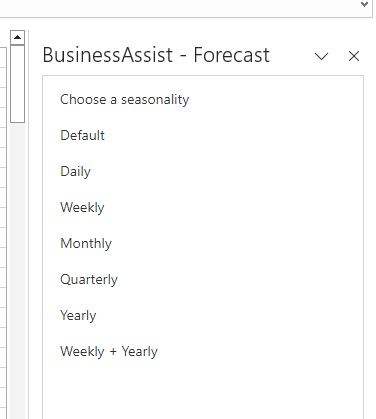
For this example, we’ll keep things simple and stick with the Default option. This allows the Business Assist Forecast tool to automatically determine the best seasonality to apply based on the data, an excellent starting point.
Select the ‘Default‘ seasonality option then click on the ‘Run Forecast‘ button that will appear in the ‘Business Assist Forecast‘ Window. The forecast will then run. Note this process can take several seconds depending on the quantity of data and speed of your computer processor.
3. Forecast Results
When the Business Assist Forecast has completed you’ll see the message ‘Job Completed Successfully!‘ in the ‘Business Assist Forecast‘ Window. There will also be two new worksheets created, ‘Predictions‘ and ‘Chart‘.
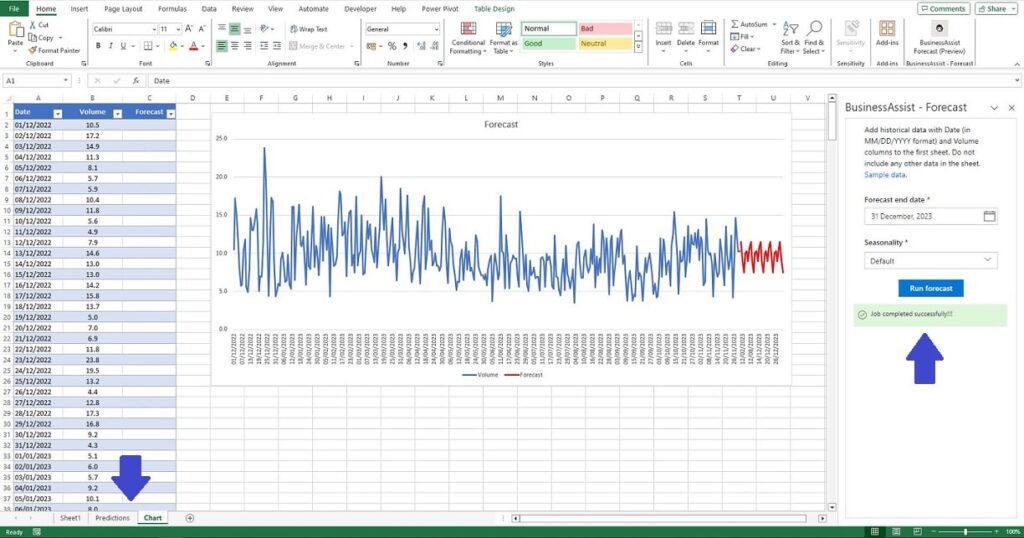
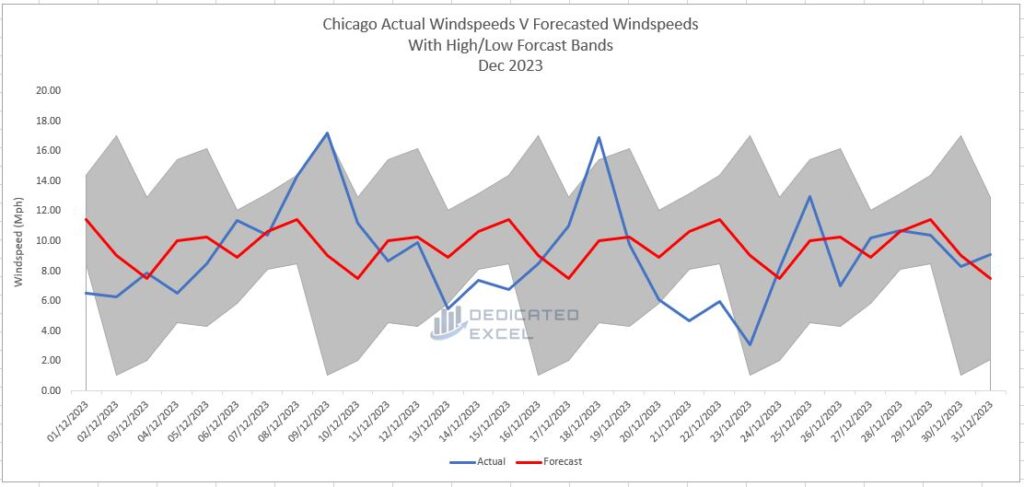
Chart
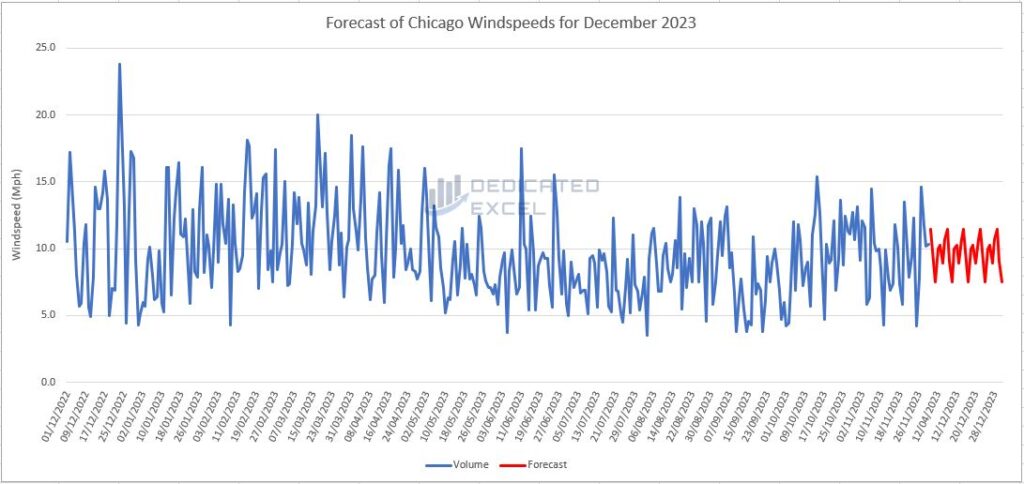
The ‘Chart‘ worksheet displays the actual data we provided (for Dec-22 to Nov-23) along with the newly forecasted data for December 2023. This chart provides a visual representation of our forecast.
In our example the forecast, represented by the red line, appears to be aligned with our actual data, represented by the blue line.
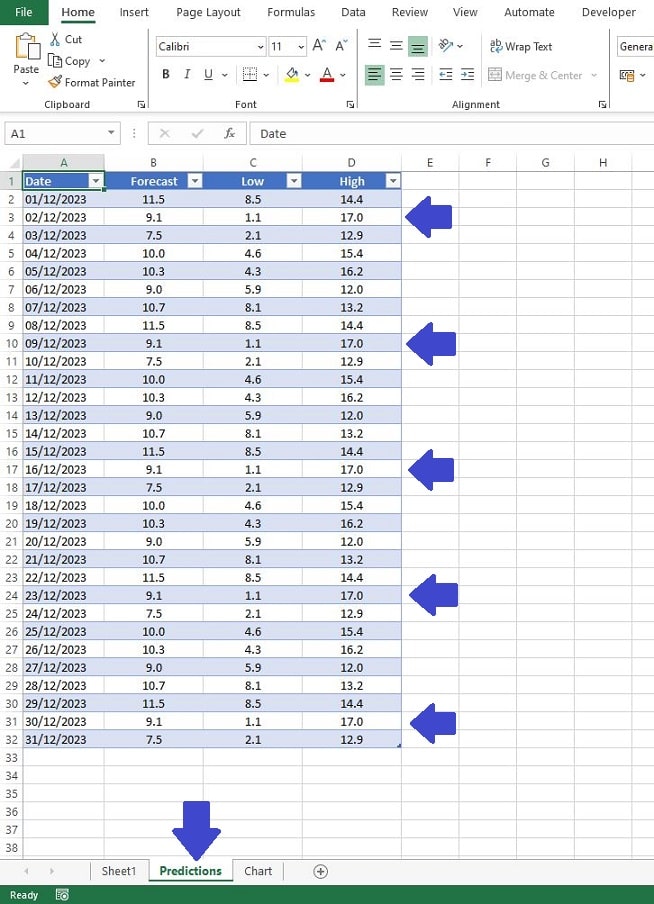
Predictions
The ‘Predictions‘ worksheet contains a table showing the forecasted values for the forecast period, along with the Low forecast and the High forecast.
- Forecast: This is the forecast generated from our data, based on the seasonality factor selected. In this case we selected the ‘Default’ option so these numbers are effectively the ‘Default’ wind speed forecast values.
- Low: The low forecast is the lower boundary or ‘floor’. It’s the lowest value we predict, given the historical trends. It’s not the absolute minimum possible, but it’s a conservative estimate below which we expect the actual data will not fall.
- High: This is the upper boundary of our prediction. It’s not the absolute maximum that could ever occur, but rather the highest value we reasonably expect based on the patterns observed in the past. Think of it as a ‘ceiling’ that we’re fairly confident our actual values won’t exceed under normal circumstances.
Using the Business Assist Forecast tool we have now forecasted the Average Daily Wind Speed for Chicago for December 2023. There are multiple days where we forecast a potential high of 17mph, December 2nd, 9th, 16th, 23rd and 30th!
Is the Business Assist Forecast Accurate?
Generating a forecast is easily done with the Business Assist Forecast Add-in but one question that comes up is whether the forecast is accurate?
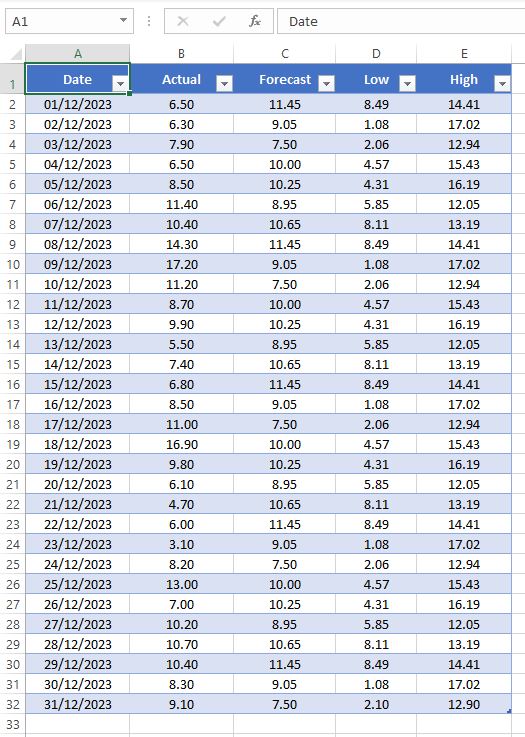
We can do a simple test for accuracy the best way possible. Let’s populate our Predictions table with the Actual Average Daily Wind Speed for Chicago in December 2023:
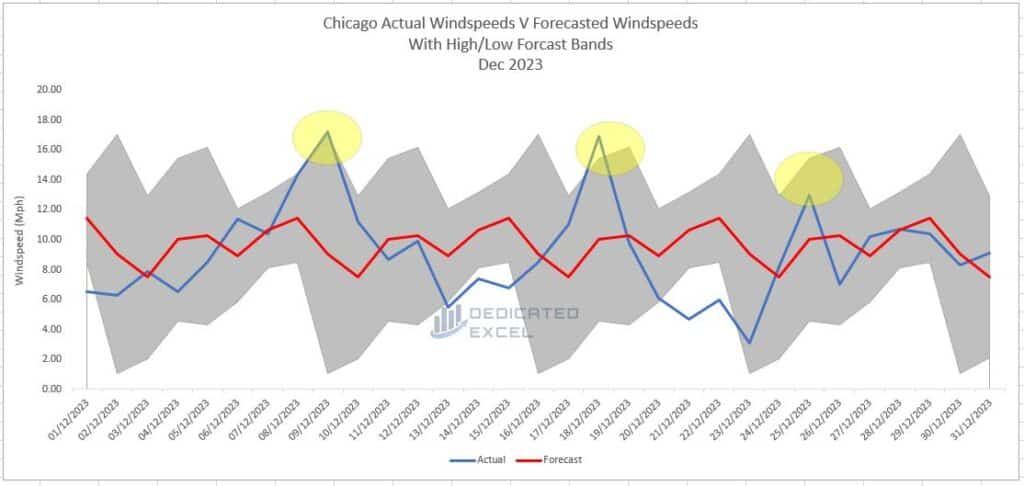
Visual Analysis of the Forecast
Now that we have the Actual Wind Speed values we can plot everything on a chart and visualize how good the forecast looks.
The chart shows the Actual Average Daily Wind Speed, represented by the blue line, generally fell within our lower and upper forecasts (the shaded area of the chart). This is a promising sign for the forecast.
There also appears to be some identification in the forecast as to when high winds might occur. For example we capture peaks in the Wind Speed with our ‘High‘ forecast (aka upper bounds).
Statistical Analysis of the Forecast
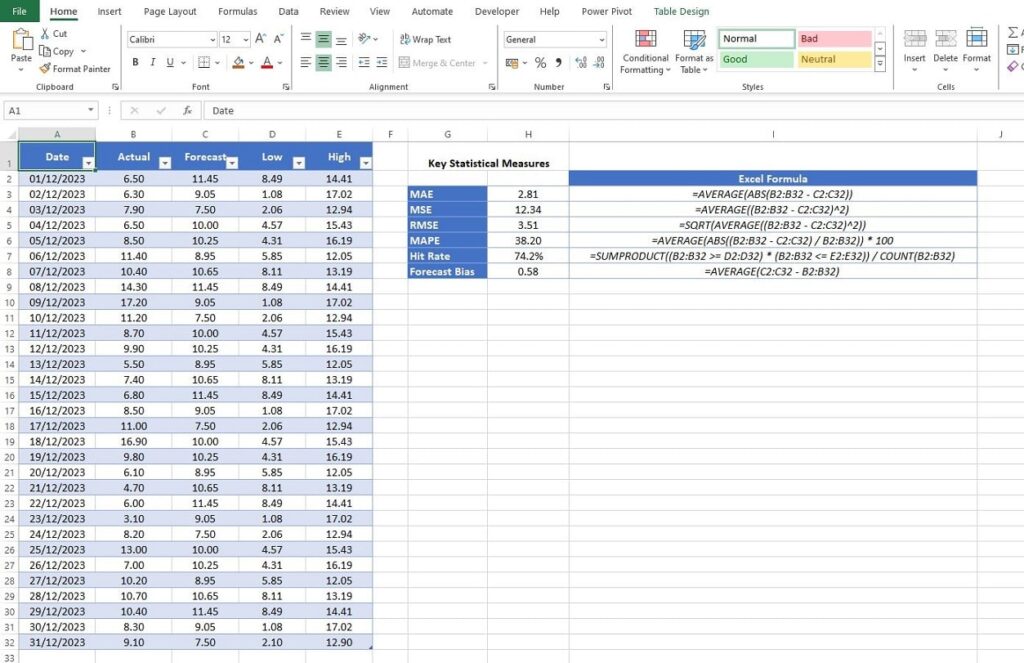
The visual assessment looks promising but we can also delve into calculating some statistical measures of how the forecast performs. Some key metrics, along with the formulas for Excel, we can use are:
- Mean Absolute Error (MAE): =AVERAGE(ABS(B2:B32 – C2:C32))
- Mean Squared Error (MSE): =AVERAGE((B2:B32 – C2:C32)^2)
- Root Mean Squared Error (RMSE): =SQRT(AVERAGE((B2:B32 – C2:C32)^2))
- Mean Absolute Percentage Error (MAPE): =AVERAGE(ABS((B2:B32 – C2:C32) / B2:B32)) * 100
- Hit Rate: =SUMPRODUCT((B2:B32 >= D2:D32) * (B2:B32 <= E2:E32)) / COUNT(B2:B32)
- Forecast Bias: =AVERAGE(C2:C32 – B2:B32)
Statistical Results
Mean Absolute Error (MAE) – 2.81
The MAE gives us a straightforward view of how ‘off’ our forecasts are, on average, without getting overly complicated with mathematics. It’s like measuring the average distance from the bullseye on a dartboard — a lower MAE means we’re consistently closer to the centre. With an MAE of 2.81, our forecasts are, on average, 2.81 units away from the actual wind speeds. In the context of daily wind speeds, this indicates a relatively close fit; our forecasts are not too far off from the reality, making the model quite reliable for general use.
Mean Squared Error (MSE) – 12.34
MSE is a bit like MAE but with a twist — it squares the errors before averaging them. This squaring penalizes larger errors more heavily, somewhat like adding a penalty for each dart thrown much farther from the target. An MSE of 12.34 suggests that we have some forecasts that are quite a bit off, but it doesn’t tell us by how much without further calculations. This number is useful for comparing different models — the lower the MSE, the better, as it indicates fewer wild pitches in our forecasting game.
Root Mean Squared Error (RMSE) – 3.51
RMSE is the square root of the MSE, bringing those large error penalties back down to a scale that’s comparable to our actual wind speed measurements. It’s like correcting for the harshness of the MSE’s penalty to get a better sense of average error. An RMSE of 3.51 means that our model’s predictions are typically within 3.51 units of the actual wind speeds. This is relatively close, suggesting that while there might be the occasional gusty outlier, our model is quite handy at predicting wind speeds.
Mean Absolute Percentage Error (MAPE) – 38.20%
MAPE turns our errors into percentages, which is really intuitive — it tells us by what percentage we’re off on average. A MAPE of 38.20% means that our forecast deviates from the actual wind speed by that percentage on average. Now, while 38.20% might seem high, wind speeds can be unpredictable, so some variability is expected. Nevertheless, it does indicate there’s room for improvement in our model, especially if precision is key for our end use.
Hit Rate – 74.2%
The hit rate tells us how often our forecasts fall within the range we expected — think of it as our accuracy in predicting within a safe zone. With a hit rate of 74.2%, nearly three-quarters of our forecasts are spot on, landing within our predicted high and low values. This is a solid score, suggesting that our model is reliable enough for planning activities that depend on wind speed, although there’s still a one-in-four chance that our predictions might miss the mark.
Forecast Bias – 0.58
Forecast bias is about direction — are we consistently overestimating or underestimating the wind speeds? A bias of 0.58 tells us that our model has a slight tendency to overshoot the actual wind speed, but only by a little. This is like consistently throwing darts that land just a tad too high on the board. In practical terms, this small bias means our model is fairly well-calibrated, with just a touch of optimism in its predictions.

Business Assist Forecast Performance Summary
Our wind speed forecasting model for Chicago shows promising results, along with room for refinement. With a Mean Absolute Error (MAE) of 2.81, our model’s average prediction is close to target, missing the actual wind speeds by a small margin. This level of accuracy is encouraging, especially considering the complex nature of wind patterns.
The Mean Squared Error (MSE) and Root Mean Squared Error (RMSE) at 12.34 and 3.51, respectively, tell us that while we do have some larger errors, they aren’t excessively skewing our predictions. Most of our forecasts are within a reasonable range of the actual figures, suggesting that the model is fairly robust.
However, the Mean Absolute Percentage Error (MAPE) stands at 38.20%, indicating that the percentage difference between our forecasts and the actual numbers can be quite significant. This level of error suggests that while the model can be a useful guide, those relying on the forecast for precise applications might need to exercise caution. For example this forecast might be acceptable for personal planning of outdoor activities but it is not accurate enough for planning commercial flight traffic.
Our Hit Rate is robust at 74.2%, which is a testament to the model’s reliability. The majority of our predictions fall within our estimated range, offering a solid foundation for planning and decision-making reliant on wind speed estimations.
Lastly, a Forecast Bias of 0.58 shows a slight tendency of the model to over-predict wind speeds, but this is a minor overestimation and is generally manageable.
In essence, our forecast performs well in a general sense and serves as a reliable guide for what to expect with wind speeds in Chicago. It’s particularly useful for applications where being in the right ballpark is more important than pinpoint accuracy. As with any model, there’s always potential for further tuning, especially to reduce the percentage error and tighten up the accuracy for those who need it.
Alternative Forecasting Options in Excel
While the Business Assist Forecast Add-in provides a user-friendly and efficient way to predict future values based on historical data, it’s not the only path you can take in Excel to glimpse into the future. Here are several other forecasting methods that you might consider, depending on your needs and expertise:
Built-in Forecast Sheet
Excel has a built-in feature called the Forecast Sheet, which uses the industry-standard Exponential Smoothing algorithm. It’s a quick, no-code solution that’s ideal for users who want to generate forecasts with just a few clicks. This can be particularly useful if you’re looking for a simple and quick forecast without the need for additional installations or Add-ins.
Trendline in Charts
You can add a trendline to your chart data to project future trends visually. This method can be a good fit if you want to present your data graphically and provide a visual estimate of future trends.
Moving Average
Using a simple moving average formula, you can smooth out short-term fluctuations and highlight longer-term trends or cycles. This technique is beneficial for those who need a straightforward and transparent approach to understanding trends in their data.
Linear Regression
For those comfortable with statistical analysis, linear regression can provide forecasts by establishing the relationship between variables and predicting future values. It’s suitable for users who need a more statistical and precise forecasting method.
Custom VBA Functions
If you have the knack for programming, creating custom functions using VBA can give you the flexibility to build tailor-made forecasting models that fit your specific criteria. This is a powerful approach if you have unique forecasting needs that can’t be met by off-the-shelf solutions.
Solver Add-in
For more complex forecasts involving multiple variables and constraints, the Solver Add-in can be employed to find optimal values for a formula in one cell—known as the target cell—on a worksheet. This is recommended for advanced users who are dealing with intricate forecasting scenarios.
Data Analysis Add-in
This Add-in provides tools for statistical and engineering analysis including regression, and it can be applied for forecasting when you have a dataset that follows a predictable pattern. It’s a step up from the basic forecasting methods and is ideal for users with a bit of statistical background.
Each of these options comes with its own set of advantages. Some are more user-friendly, while others offer greater precision or flexibility. The choice to use these over the Business Assist Forecast Add-in might be influenced by factors such as the complexity of your data, your comfort level with Excel’s features, or specific requirements of your forecasting scenario. Always consider the nature of your dataset, the required accuracy of your predictions, and the level of effort you can commit to maintaining your forecasting tool when choosing the best method for your needs.
Summary
In summary, the Business Assist Forecast Add-in stands out as an excellent tool for those dipping their toes into the world of forecasting, particularly if you’re not well-versed in the nitty-gritty of forecasting techniques or Excel’s advanced functionalities. Throughout this post, we’ve seen how it simplifies the process of creating a forecast, even with something as variable as Chicago’s wind speeds, and how it helps you make sense of the future with a few straightforward steps.
This Add-in is user-friendly and requires no deep expertise in Excel, making it an ideal choice for beginners or those who need a quick forecast without a steep learning curve. It’s clear that while the Business Assist Forecast Add-in may not cater to every intricate forecasting need, it’s a solid choice for basic forecasting tasks.
Whether you’re trying to predict sales, manage inventory, or like us, understand wind patterns, this tool can offer the insights you need with minimal fuss. For many users, that’s exactly the kind of practicality that makes Excel such a valuable tool in both professional and personal endeavours.
Keep Excelling,

Just finished delving into the intricacies of Excel forecasting? Give your eyes a well-deserved break with our next guide: ‘Enable Dark Mode in Excel for Eye-Friendly Work‘—perfect for those late-night analysis sessions!