
Exploring the nuances of Excel pivot tables? Learn how to count unique records in a pivot table with our comprehensive guide, designed to enhance your data analysis skills and streamline your workflow.
Introduction
In this informative post, we’ll dive into the key process of how to count unique records in a pivot table. I will walk you through each step, providing essential tips to enhance the accuracy and efficiency of your data analysis.
This post is tailored for both beginners and seasoned Excel users, focusing on empowering you with the skills needed to count unique records in a pivot table, ensuring you leverage the full capabilities of pivot tables for more effective data management.
Example
To illustrate the problem and solution we can start with a basic example.
Take the following data-set containing staff sales for various locations throughout the United Kingdom:

With this data it is possible to create an Excel Pivot Table that shows:
- Location
- Total Units Sold
- Total Value of Units Sold
- Number of unique staff members that have made a sale in that location
This seems straight-forward to create using the standard Pivot table creation method, however you will notice that by counting the staff name the pivot table does not count unique names, there is no option to make the count based on unique names.
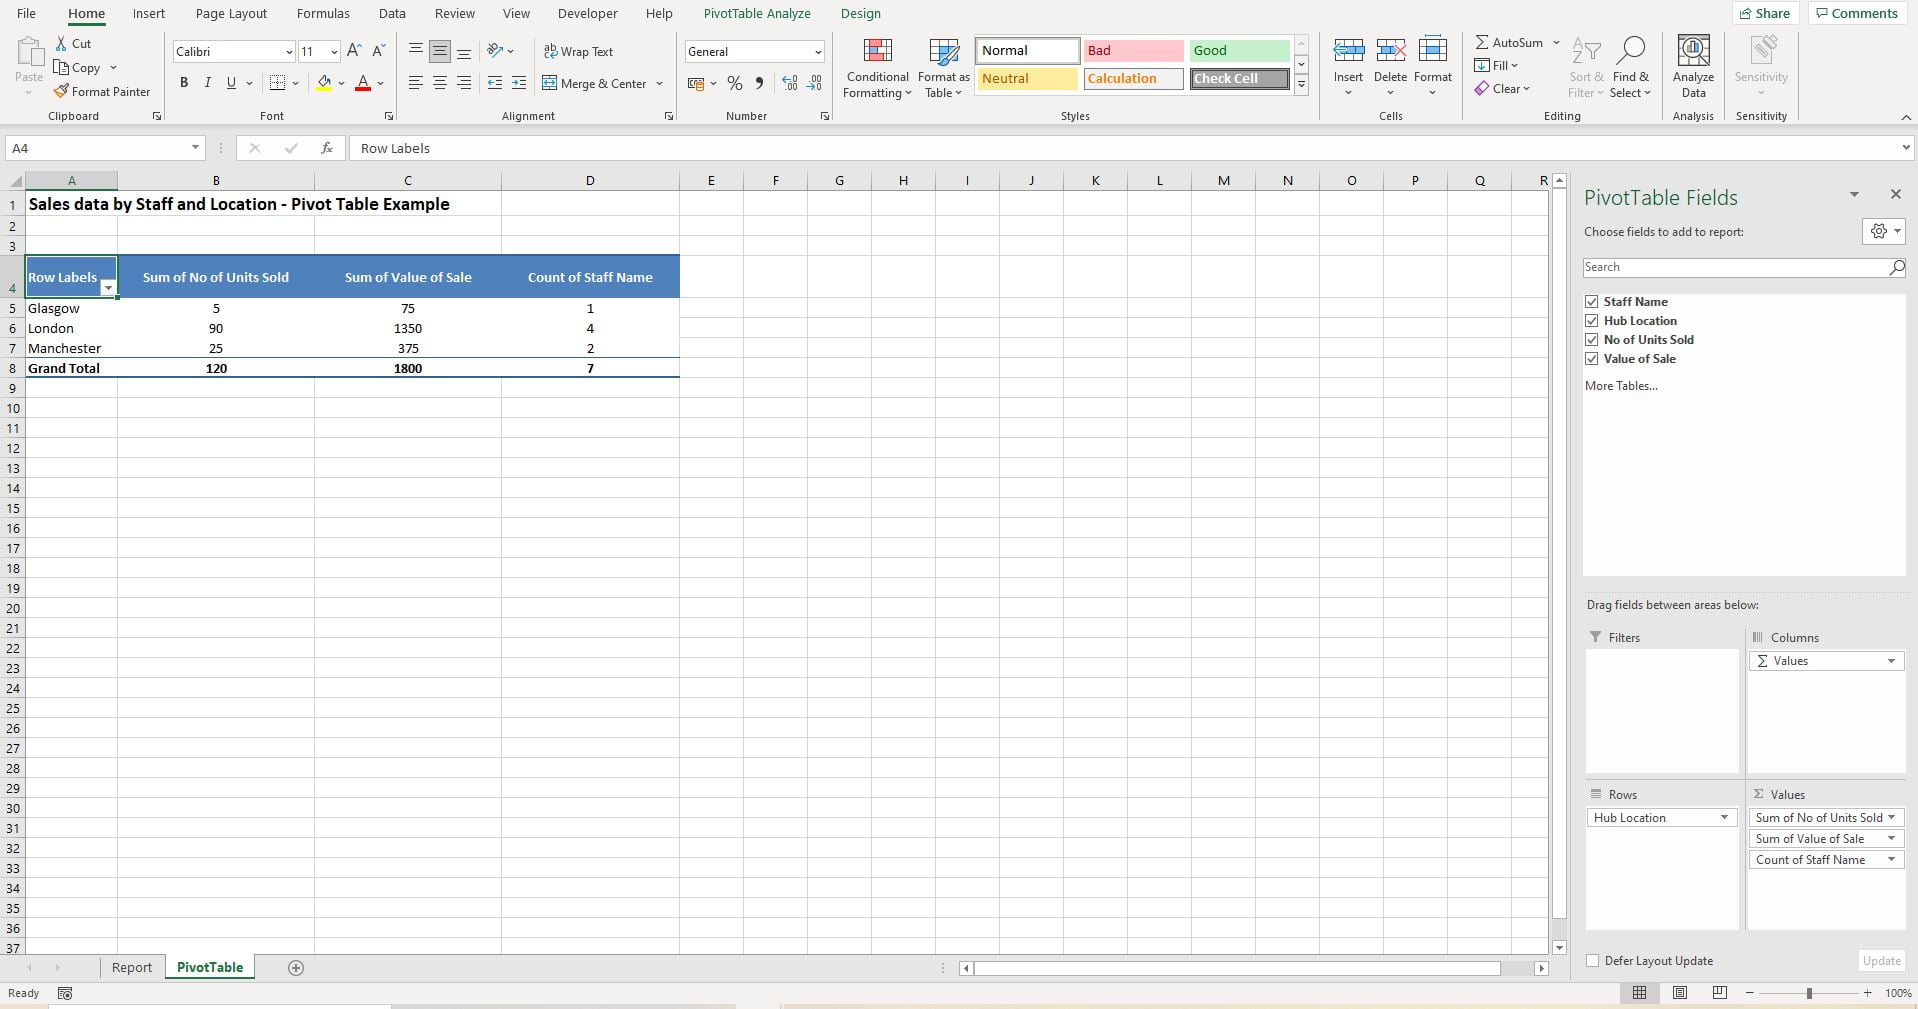
The PIVOT table shows that we can easily sum the volumes and sales by location but it counts all staff names found, not just the unique staff names.
For example in Manchester only Peter Smith has made any sales so the aim is to show this location as having only one member of staff making sales. At the moment it shows a value of 2 so the question is not being answered.
Count Unique Records in a Pivot Table
To resolve the problem we need to add another column to the original data table, this will act as a counter that can be summed up in the pivot table to provide a unique count of staff names.
The solution makes use of the SUMPRODUCT function and by nesting that function within an IF statement it is possible to count unique records in the data-set.
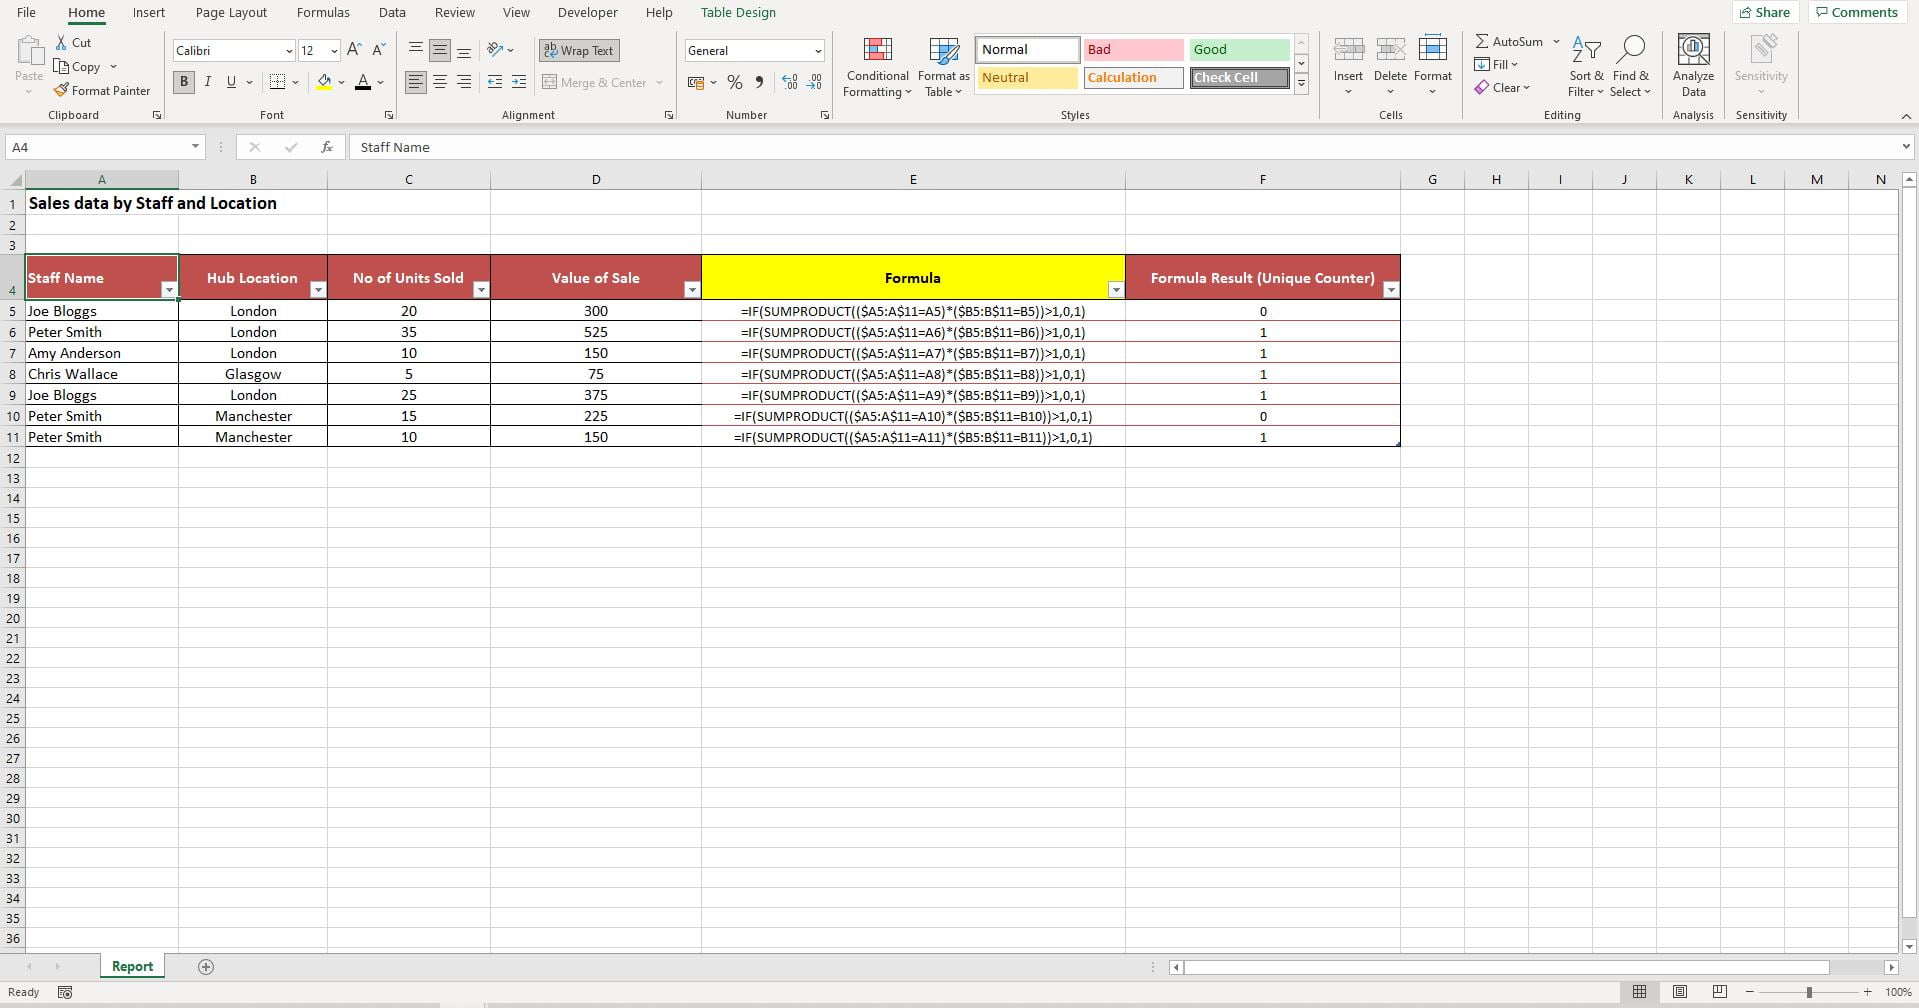
With Staff Names starting in cell A5 and locations starting in cell B5 the formula for counting the unique staff names found by location is:
- =IF(SUMPRODUCT(($A5:A$11=A5)*($B5:B$11=B5))>1,0,1)
Note that for this example the data range ends at row 11 hence the formula goes from A5:A11 and B5:B11. Make sure that your entire data range is covered by this formula for it to work as intended.
In the next image you can see the example formula for each record along with its result. Note that the dollar signs in the formula lock in the range, this means you enter the formula in the first cell and then drag the formula down the entire data range so it automatically updates for each cell:
From the enhanced data-set we can recreate the Excel pivot table.
This time instead of counting the Staff Names we can Sum the Unique Counter:
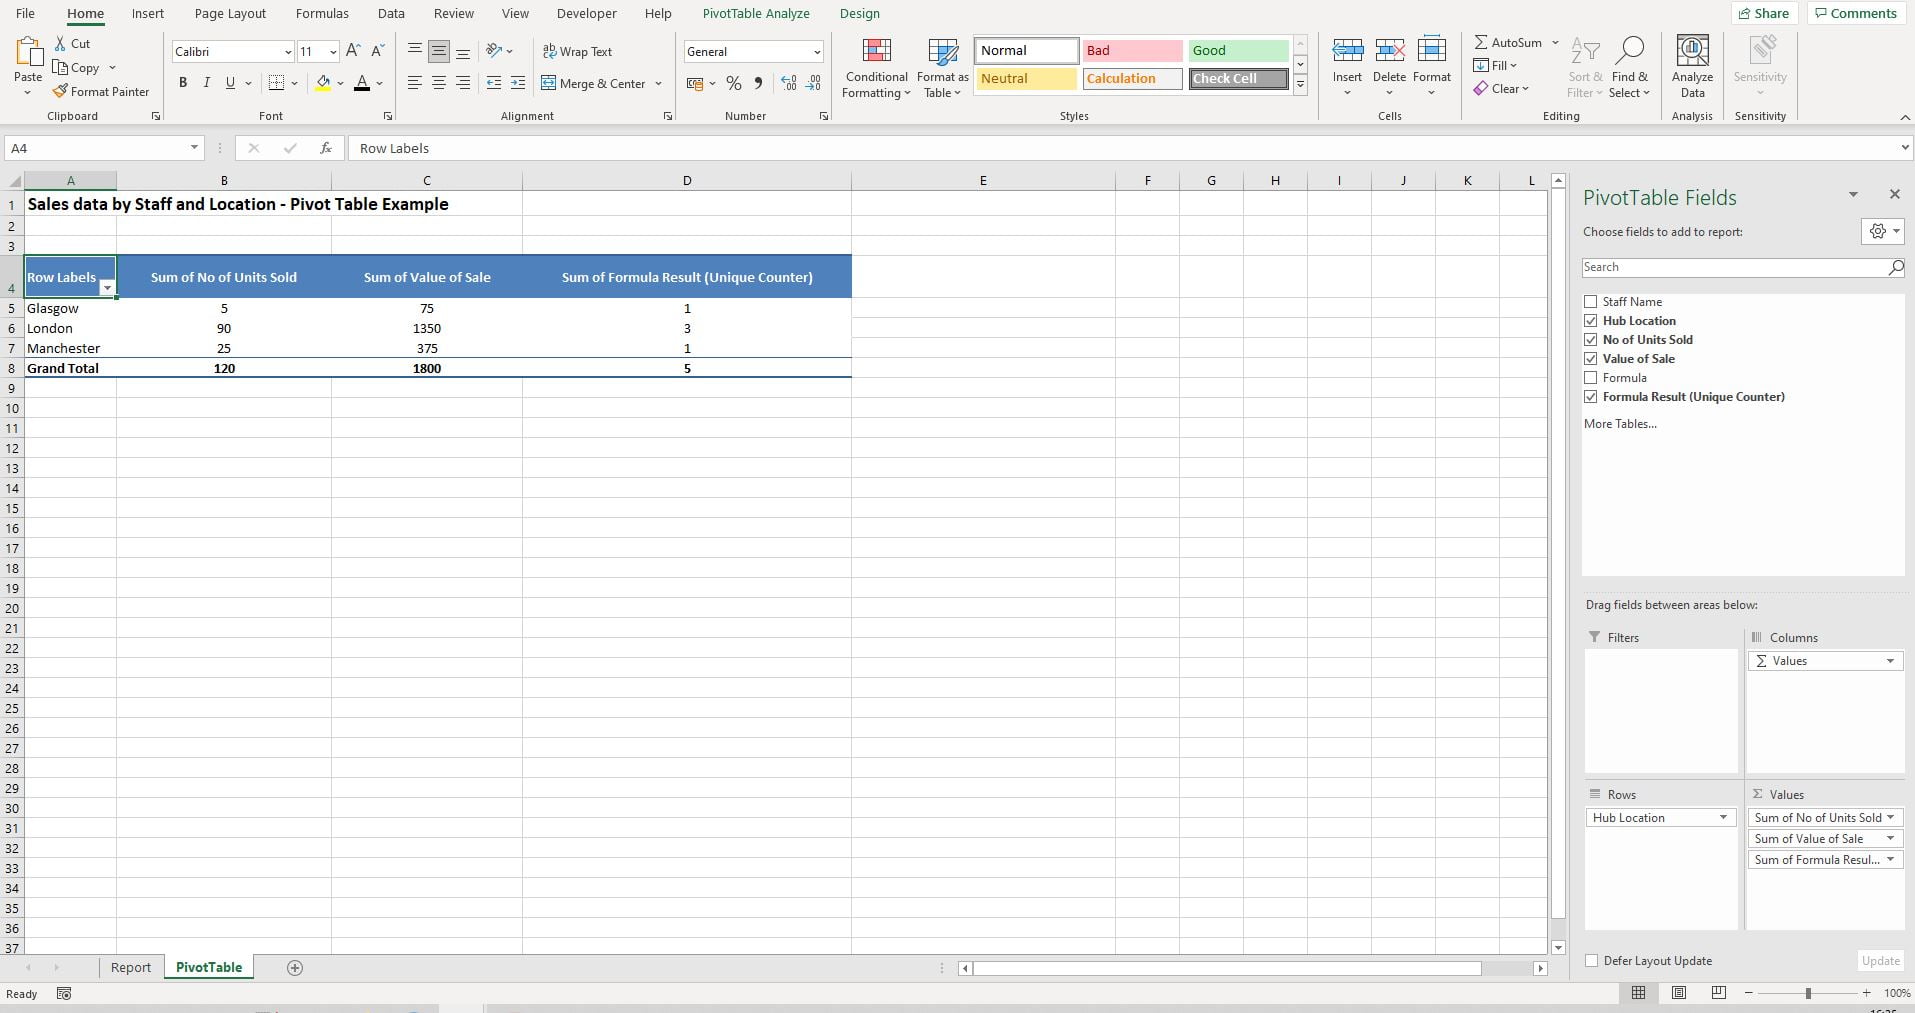
A quick sense check of the data shows that we now show just one member of staff as having completed sales in the Manchester location, this has resolved the problem and the table now shows Unique members of staff as the counter.
It is possible to apply this logic across any fields in the data-set where a unique count is needed, all that is required is amending the formula to point to the correct ranges and cells.
Summary
- To count unique records in a pivot table and show the results in a pivot table you need to add a helper column to your original data-set.
- Use the SUMPRODUCT function within an IF statement, this will count unique records in the data which can be summed on the Excel pivot table.
- Make sure your formula covers the entire data range and take note where your absolute references are (dollar signs in the formula). If you don’t yet understand absolute references you can read up on them here.
- Always sense check a few results to make sure your formula is working as intended.
Keep Excelling,

Struggling with cluttered Excel spreadsheets due to pesky blank characters? Discover the seamless way to tidy up your data with our latest post, ‘How to Remove Blank Characters from Text‘. Unlock a cleaner, more efficient spreadsheet experience now!