
Welcome to an exploration of the Excel Weighted Average Formula, a pivotal tool in the Excel user’s arsenal. This formula is crucial for accurately evaluating data sets where different values hold varying degrees of significance. Ideal for beginners, our guide will take you through the nuances of computing a weighted average in Excel, empowering you to enhance your analytical capabilities with this essential technique.
- What is a Weighted Average?
- Why Choose a Weighted Average over a Normal Average?
- Step-By-Step Guide to the Excel Weighted Average Formula
- Streamlined Calculations using the SUMPRODUCT function
- Benefits of Using a Weighted Average
- Summary
What is a Weighted Average?
A weighted average, unlike a simple average, assigns varying weights to different values, accounting for their relative importance. This method is indispensable in areas like financial analysis, academic grading, and comprehensive data assessments.
Why Choose a Weighted Average Over a Normal Average?
- Reflecting Importance of Different Elements: In scenarios where some data points are more significant than others, a weighted average gives a more accurate representation. For instance, in education, final exams might carry more weight than coursework modules.
- Managing Diverse Data Sets: When dealing with data sets that combine different types of data or units, a weighted average can normalize these differences. This is common in financial analyses like portfolio returns.
- Adjusting for Frequency or Volume: In cases where the frequency or volume of data points varies significantly, such as in sales data, a weighted average can provide a more balanced view, accounting for these variations.
Step-by-Step Guide to the Excel Weighted Average Formula
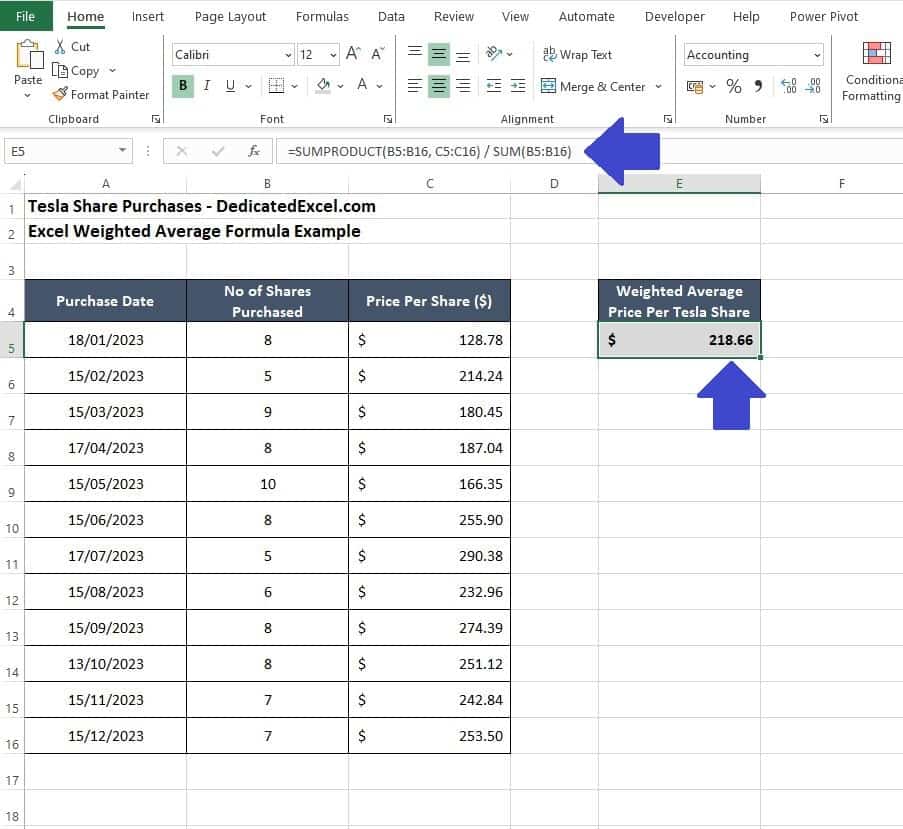
Let’s dive into a realistic example: assessing the average purchase price of Tesla shares in your portfolio over a year. This scenario will illustrate how the weighted average formula in Excel is a vital tool for accurately evaluating your investments.
Imagine managing a stock portfolio where you’ve invested in Tesla shares at various prices and quantities throughout the year. To ascertain the average price you paid per share, the Excel Weighted Average Formula is your go-to tool.
Download the Excel Weighted Average Formula Template
If you want to follow along with the example please download the Excel Weighted Average Formula Template. This template contains the sample data, along with completed examples containing the weighted average formulas so you can check your work.
Download Excel Weighted Average Formula TemplateOrganize Your Data
As is always good practice the first step is to arrange your data in Excel.
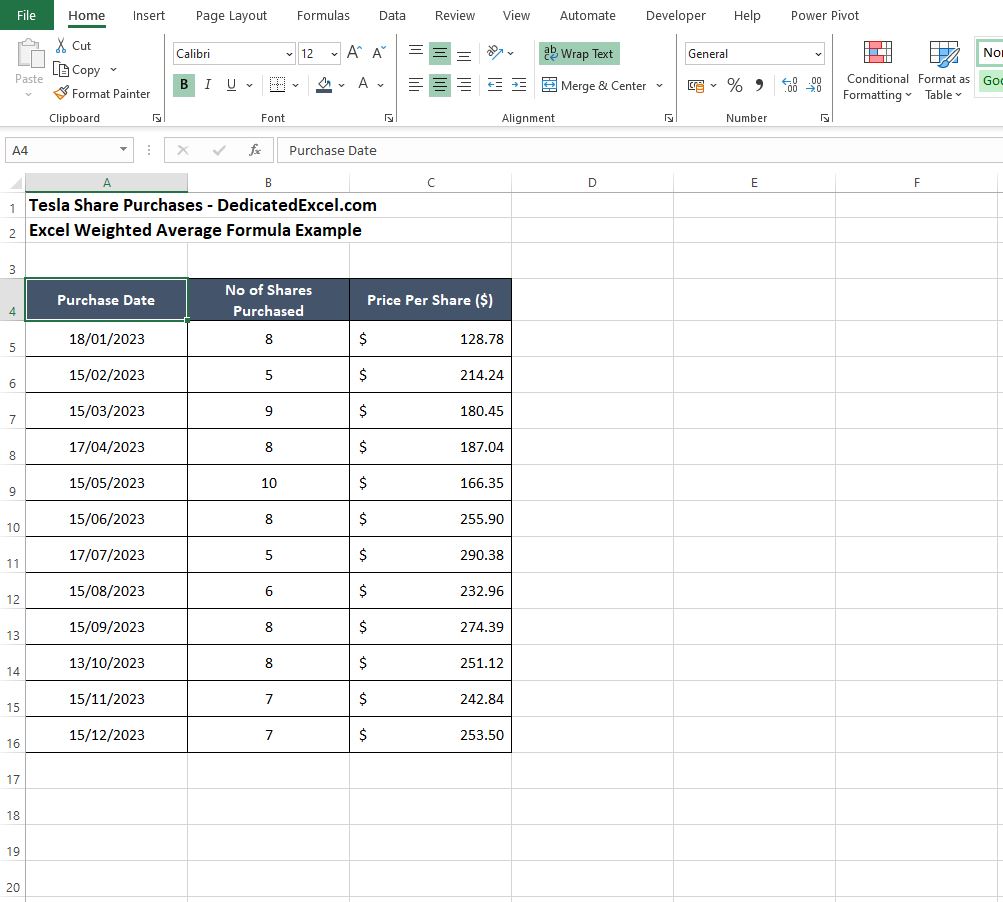
For this example ensure the purchase data is in three columns with headers: ‘Purchase Date‘ in column A, ‘No of Shares Purchased‘ in column B, and ‘Price Per Share ($)‘ in column C.
The data spans from rows 5 to 16 (row 4 is headers).
Calculate Total Cost per Purchase
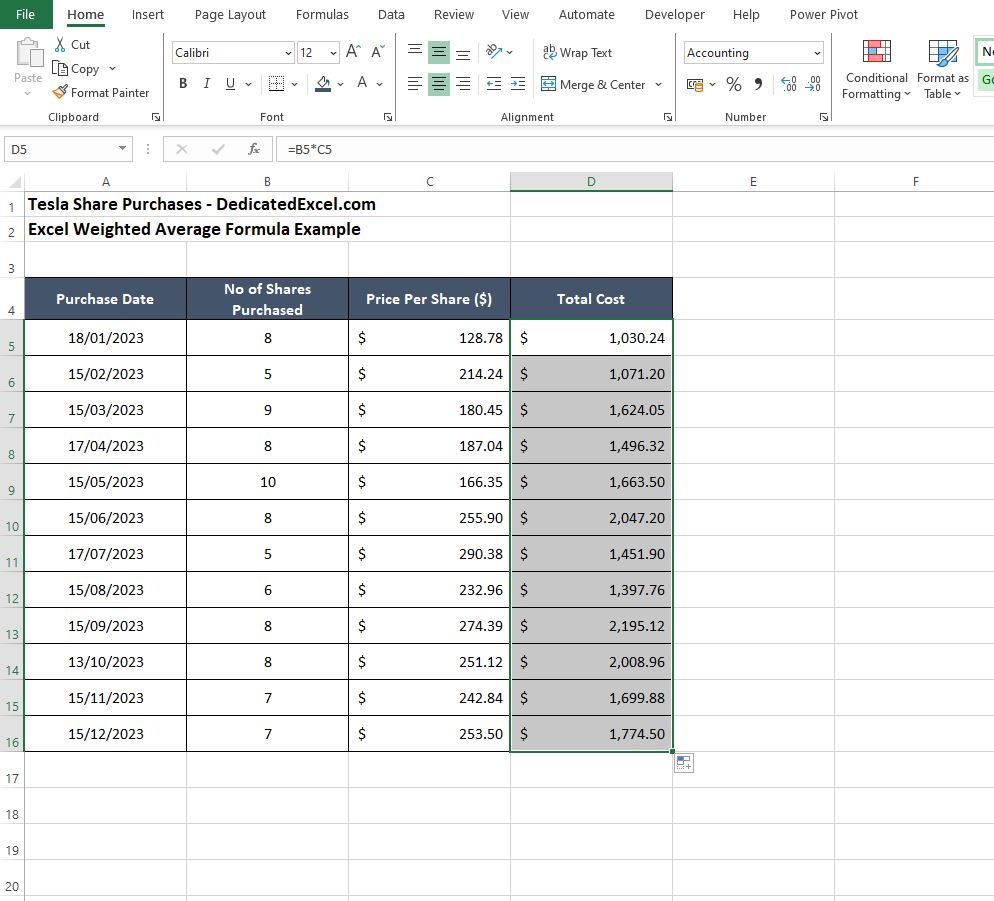
Now that the data is neatly organized we can add a column to calculate our ‘Total Cost‘ for each purchase.
- In a new column D, titled ‘Total Cost‘, enter the formula =B5*C5 in cell D5.
- Drag the fill handle (a small square at the bottom-right corner of the cell) down to cell D16 to apply this formula to all purchases.
Sum of Total Costs and Total Shares
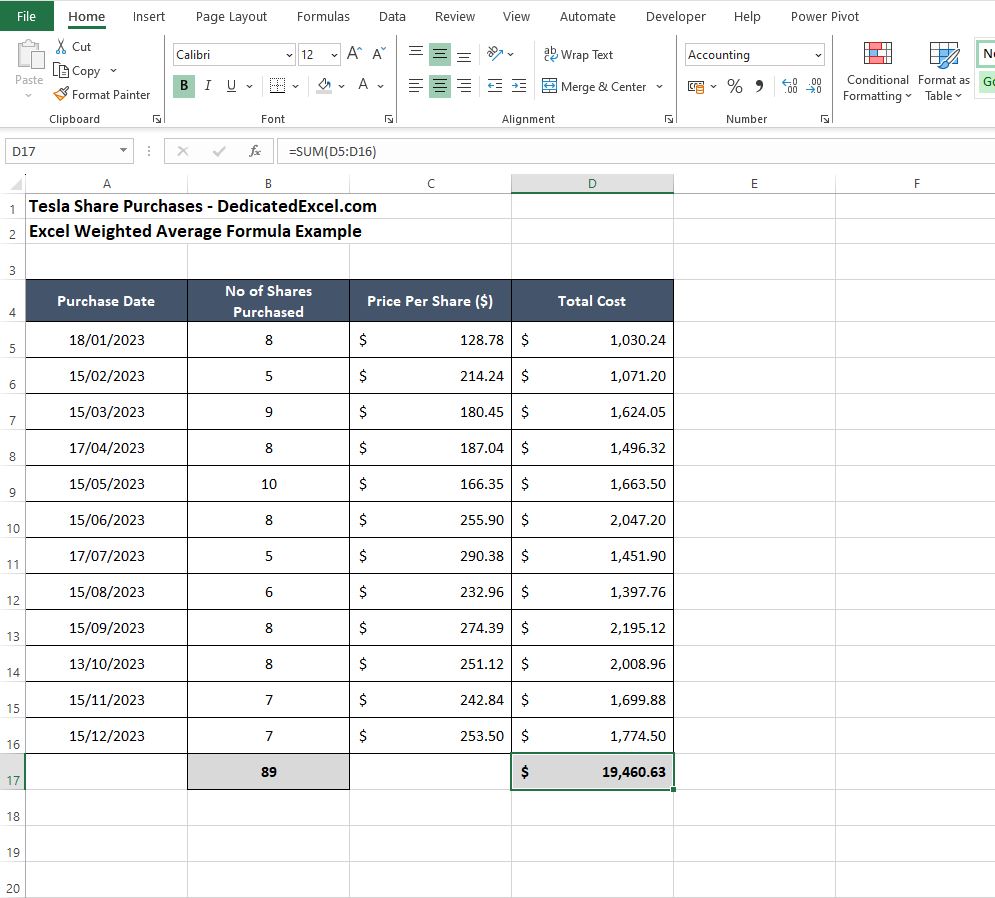
Next we can sum the number of shares purchased and the total cost of all the purchases made throughout the year.
- In cell B17, sum up the ‘No of Shares Purchased‘ by entering =SUM(B5:B16).
- In cell D17, sum up the ‘Total Cost‘ column by typing =SUM(D5:D16).
Apply the Weighted Average Formula
Lastly with our totals calculated we can apply the Weighted Average Formula.
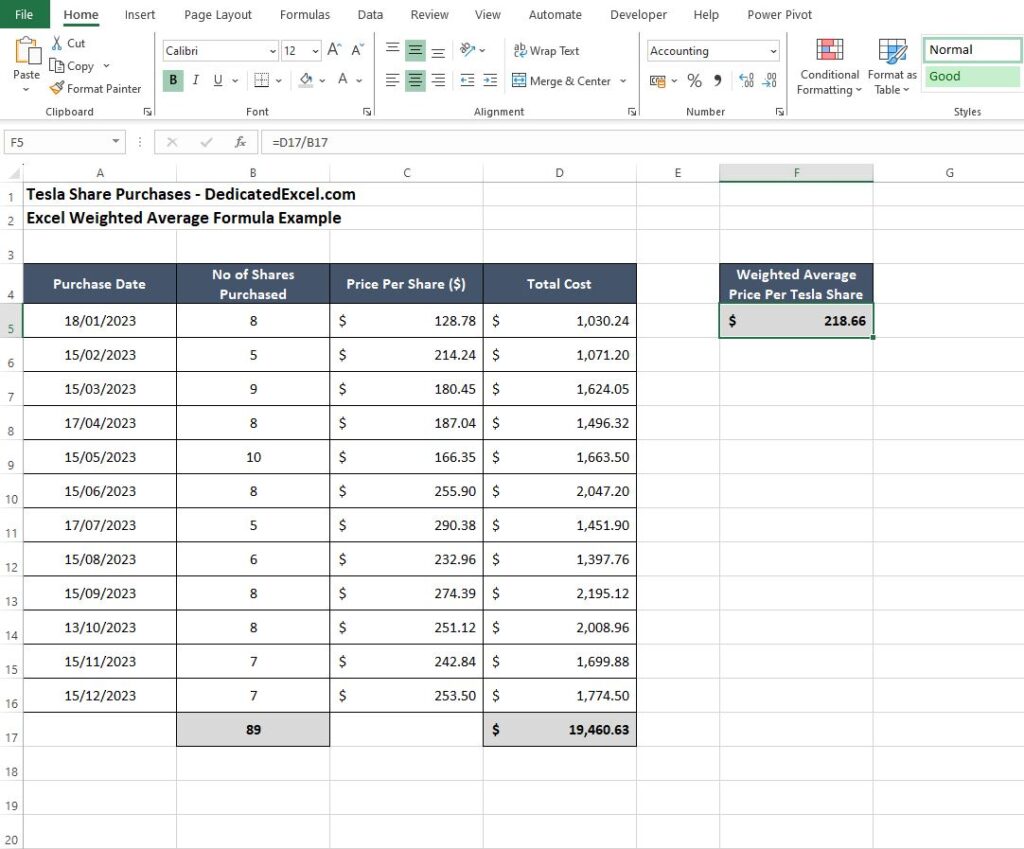
- In cell F5 (or any other cell where you want the weighted average to appear), input the formula =D17/B17.
- This will divide the sum of all total costs by the sum of all shares purchased to give you the weighted average price per share.
- The data shows that our Weighted Average Price Per Tesla Share is $218.66.
Streamlined Calculation with the SUMPRODUCT Function
While the step-by-step approach provides a clear breakdown of calculating a weighted average, the Excel weighted average formula can be computed more efficiently using the SUMPRODUCT function.
This powerful function is tailor-made for scenarios where you need to multiply corresponding components in given ranges and then sum up those products — ideal for determining the weighted average with ease and precision.
To use the SUMPRODUCT function as an alternative way of calculating the ‘Weighted Average Price per Tesla Share‘ for your portfolio we can use the following formula:
- =SUMPRODUCT(B5:B16, C5:C16) / SUM(B5:B16)
Understanding the SUMPRODUCT Formula for Excel Weighted Average Calculations
When using the SUMPRODUCT function to calculate the Excel weighted average formula, you’re essentially combining several steps into one efficient operation. Let’s break down the formula to ensure a thorough understanding of how SUMPRODUCT accomplishes this:
- =SUMPRODUCT(B5:B16, C5:C16) / SUM(B5:B16)
- Component Multiplication
- ‘=SUMPRODUCT(B5:B16, C5:C16)‘
- Within this part of the formula, SUMPRODUCT takes two arrays — the first (B5:B16) representing the number of shares purchased each month, and the second (C5:C16) representing the corresponding price per share.
- It then multiplies each number of shares by its corresponding share price. This is done for each row where the number of shares and the share price align.
- Summation of Products
- After the individual multiplication of shares and price for each row, SUMPRODUCT adds up all these products.
- The result is the total monetary amount invested in the shares across all purchases.
- Division for Average
- ‘SUM(B5:B16)‘
- This part sums the total number of shares purchased over the entire period.
- The SUMPRODUCT total is then divided by the total number of shares to calculate the weighted average price per share.
The formula’s division aspect is what converts the total investment into an average, taking into account the varying quantities of shares purchased at each price point. By doing so, you get a weighted average price that accurately reflects your investment strategy over the year, considering the different volumes bought at each price level.
In essence, the SUMPRODUCT function is doing the heavy lifting by computing both the multiplication and the addition of the weighted components, streamlining what would otherwise be a two-step process into a single formula. This demonstrates the power and efficiency of using Excel’s functions to simplify complex calculations.
Benefits of Using the Weighted Average in Excel
The weighted average is a statistical measure that provides a more nuanced understanding of your data set compared to a simple average. By factoring in the relative importance or size of each component, it delivers insights that are critical in many professional scenarios. Here are some of the key benefits of using the weighted average, particularly within Excel:
Accuracy in Financial Analysis
In financial contexts, such as stock portfolio analysis, the weighted average price reflects the true cost of your investments. It accounts for the varying quantities purchased at different price points, offering a precise measure of performance over time.
Decision Making
Weighted averages can influence decision-making processes by highlighting which factors should carry more influence based on their significance to the overall analysis.
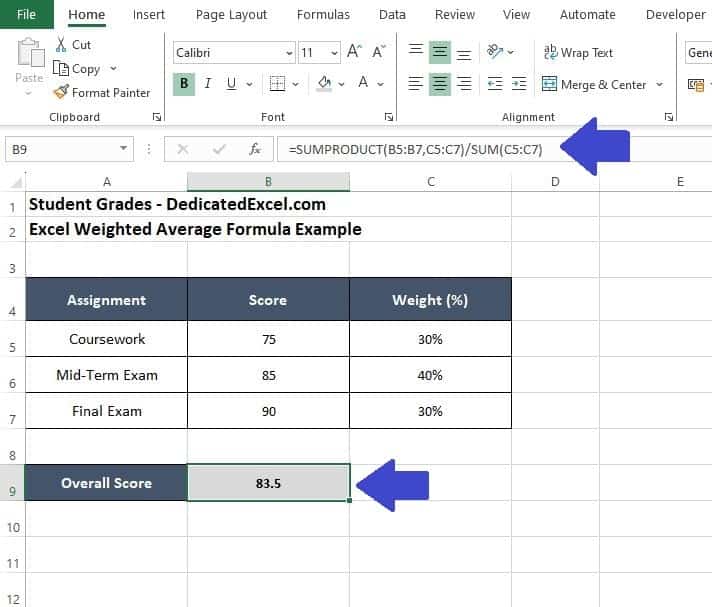
Fair Evaluation in Academics
When calculating a student’s overall grade, the weighted average ensures that more significant assessments (like exams) have a proportionate impact on the final grade, leading to a fairer evaluation of the student’s performance.
Business and Inventory Assessments
Businesses often use weighted averages to determine the average cost of inventory when prices fluctuate. This method provides a realistic cost figure that affects pricing strategies, profitability analysis, and financial reporting.
Survey Analysis
In surveys, weights can be applied to responses to reflect their relevance or the respondent’s demographic representation, leading to more representative and actionable insights.
Resource Allocation
Organizations can utilize weighted averages to allocate resources more effectively, such as budgeting based on project importance or expected return.
Risk Management
In risk assessments, assigning weights to different risks based on their potential impact can help prioritize risk management efforts and resources.
Performance Metrics
Companies use weighted averages to assess performance metrics where certain performance indicators are more critical than others, ensuring that key drivers of success are emphasized.
In Excel, the ability to quickly calculate weighted averages allows users to integrate these benefits seamlessly into their data analysis and reporting processes, ultimately leading to more informed and strategic decisions.
Summary
Understanding when and why to use the Excel Weighted Average Formula over a simple average is key to its effective application. It’s not just about how to calculate it, but knowing why it’s the better choice in certain scenarios that truly enhances your Excel capabilities.
Keep practicing with this versatile formula to gain confidence and accuracy in your data analysis tasks.
Keep Excelling,

As you’ve now mastered the art of using the Excel weighted average formula, you might be wondering how to share your newfound expertise and data with others in a professional and accessible format. Look no further! Our next post, “How to Convert Excel to PDF. Discover the simple and effective methods to transform your Excel files into PDF documents, ensuring your data is presented clearly and can be easily shared with anyone, anywhere.