
Have you ever wondered how you could tap into the ever-changing world of stocks and financial data without leaving the comfort of your Excel spreadsheet? Imagine being able to track historical market data with just a few keystrokes! This is not just a daydream for finance professionals, but a real possibility for anyone with Excel, thanks to Excel’s STOCKHISTORY function.
In this tutorial, I’ll guide you through the simple steps to leverage this powerful tool, making complex financial analyses accessible and straightforward, even for beginners.
This Post Covers
- Introduction to the STOCKHISTORY function
- Which Versions of Excel Support STOCKHISTORY?
- The STOCKHISTORY Function Explained
- Scenario 1 – Daily Stock Prices for a Specific Period
- Scenario 2 – Weekly Data Comparison for Two Stocks
- Scenario 3 – Retrieving Specific Data Types to Create a Candlestick Chart in Excel
- Scenario 4 – Create a Stock Query Tool
- Additional Use Cases for Excel’s STOCKHISTORY Function
- Summary

Introduction to the STOCKHISTORY Function
The STOCKHISTORY function in Excel is a powerful tool that allows users to retrieve historical data for stocks, including prices, volumes, and other financial information. This feature is incredibly useful for tracking market trends, analysing financial data, and making informed investment decisions.
But how does it work?
Simply put, this function fetches stock prices and other related data for a specified date range and interval.
Which Versions of Excel Support STOCKHISTORY?
It is important to note that the STOCKHISTORY function is not universally available across all versions of Excel. Understanding which versions support this function and how to check for its availability is crucial:
The STOCKHISTORY function is available in:
- Microsoft 365 Subscriptions: This includes Microsoft 365 Personal, Microsoft 365 Family, and business plans that include Office apps like Microsoft 365 Business Standard.
- Excel for the Web: Users with a Microsoft account can access Excel Online, which includes the STOCKHISTORY function.
- Excel Mobile Apps: The function is also available in Excel for iOS and Android for Microsoft 365 subscribers.
Notable Exceptions:
- Standalone Versions: Excel 2019, Excel 2016, and earlier standalone versions (not part of a Microsoft 365 subscription) do not include the STOCKHISTORY function.
Test Excel STOCKHISTORY Function
If you are still unsure if you have version of Excel supports the STOCKHISTORY function the best way is to perform a direct test:
- Open Excel.
- In any cell, start typing “=STOCKHISTORY(“
- If the function is available, Excel will display it as a suggestion in a dropdown menu. If it doesn’t appear, then it’s likely not supported in your version.
The STOCKHISTORY Function Explained
Now that you have determined you can access the STOCKHISTORY function in Excel let’s learn how to use it.
To use the STOCKHISTORY function, you’ll need the stock’s ticker symbol, start and end dates, and the data interval (daily, weekly, or monthly). The basic syntax of the function looks like this:
- =STOCKHISTORY(stock, start_date, [end_date], [interval], [headers], [property1, property2, …])
This is where:
- stock refers to the stock ticker symbol.
- start_date and optional end_date define the period for retrieving data.
- interval can be daily, weekly, or monthly.
- headers specify whether to include headers.
- property allows you to choose data types like price, volume, etc. You can select multiple properties.
What is a Ticker Symbol?
For those of you who are new to the world of stocks you might be wondering what a “ticker symbol” is?
A ticker symbol, also known as a stock symbol, is a unique series of letters assigned to a publicly traded company’s stock for identification purposes. It acts as a shorthand used on stock exchanges to simplify the identification and communication of different stocks. These symbols are particularly useful in financial reporting and trading because they unambiguously reference a specific company, avoiding any confusion.
- Length and Format: Ticker symbols typically consist of one to four letters. In the U.S., for example, stocks listed on the New York Stock Exchange (NYSE) have one to three letters (e.g., ‘F’ for Ford Motor Company), while stocks on the NASDAQ typically have four letters (e.g., ‘AAPL’ for Apple Inc.).
- Unique Identifiers: Each ticker symbol is unique to the company it represents. No two companies on the same stock exchange can have the same symbol.
- International Variations: Ticker symbols can vary in different countries. For instance, while a company may be listed with a particular symbol on the NYSE, it could have a different symbol on a non-U.S. exchange.
How to Find Ticker Symbols
There are multiple sources for finding Ticker Symbols to use in Excel. Here are some suggestions:
- Financial Websites: Websites like Yahoo Finance, Google Finance, and Bloomberg offer easy search functionality where you can enter the company’s name to find its ticker symbol.
- Stock Exchange Websites: Visiting the website of a specific stock exchange (e.g., NYSE, NASDAQ) can also provide information on ticker symbols.
- Company Websites: Publicly traded companies often list their stock symbol on their websites, typically in the investor relations section. For example, Microsoft Investor Relations.
- News and Financial Reports: Ticker symbols are commonly used in financial news reports, press releases, and other publications related to financial markets.
Scenario 1: Daily Stock Prices for a Specific Period
Let’s start simple in our quest to Unleash Excel’s STOCKHISTORY Function.
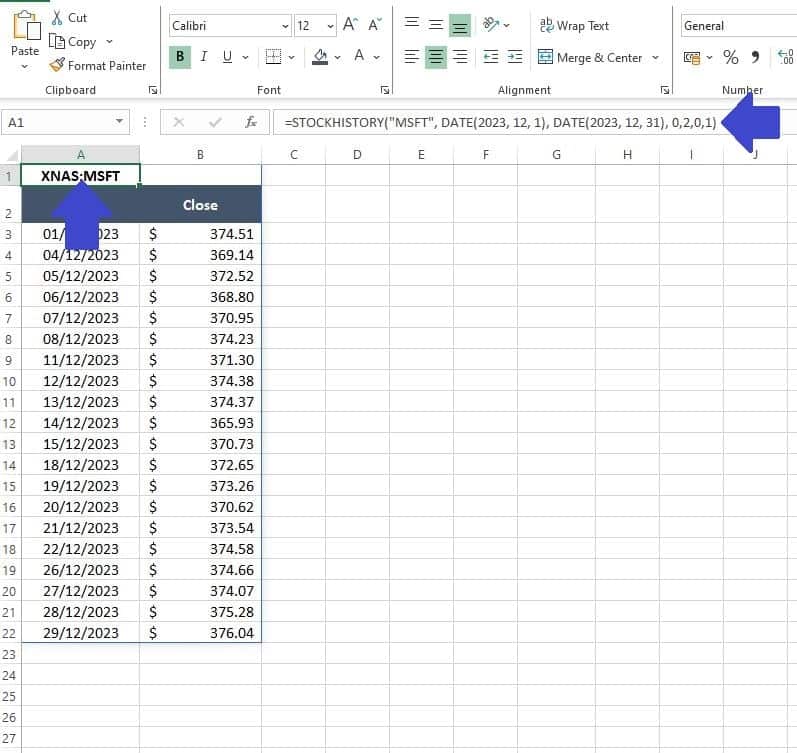
To track the daily closing prices of Microsoft’s stock for the month of December 2023 we can enter the following formula into cell A1 of our Excel worksheet:
- =STOCKHISTORY(“MSFT”, DATE(2023, 12, 1), DATE(2023, 12, 31), 0,2,0,1)
In this formula:
- “MSFT” specifies the ticker symbol for Microsoft.
- DATE(2023, 12, 1) and DATE(2023, 12, 31) set the date range from December 1, 2023, to December 31, 2023.
- 0 as the interval argument is used to get daily data.
- 2 for the header argument to show both the instrument identifier and the header.
- The final 0 and 1 specify the data types to be returned: 0 for the ‘Date‘, and 1 for the ‘Closing Price‘.
Scenario 2: Weekly Data Comparison for Two Stocks
Analysing the performance of a single stock in Excel is awesome, but what if we want to compare price data for two stocks?
In Excel, the STOCKHISTORY function does not support retrieving data for multiple ticker symbols in a single formula directly. Each instance of the STOCKHISTORY function can only handle one ticker symbol at a time. This means we need to be a little more creative to achieve our goal.
First in cell A1 we can use the following formula to return the weekly closing prices of Microsoft’s stock for November and December 2023:
- =STOCKHISTORY(“MSFT”,DATE(2023,11,1),DATE(2023,12,31),1,2,0,1)
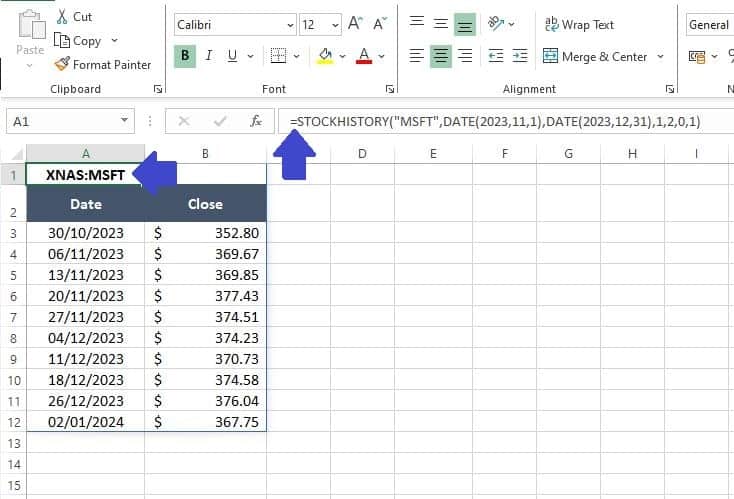
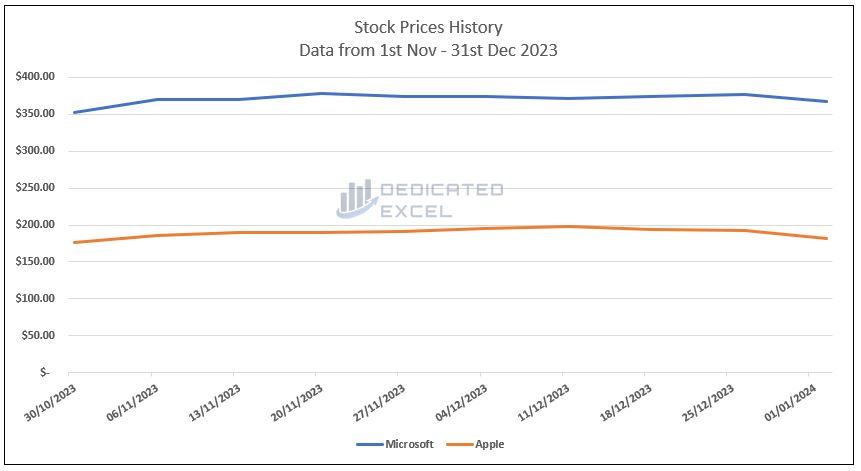
Then in cell C1 we can use the following formula to return the weekly closing prices of Apple’s stock for the same period. Note in this formula we omit the ‘Date‘ property and return only the ‘Closing Price‘ property.
- =STOCKHISTORY(“AAPL”,DATE(2023,11,1),DATE(2023,12,31),1,2,1)
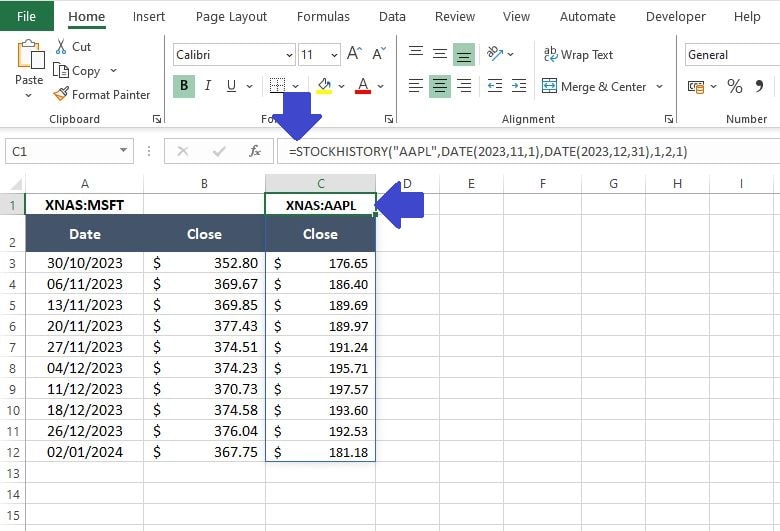
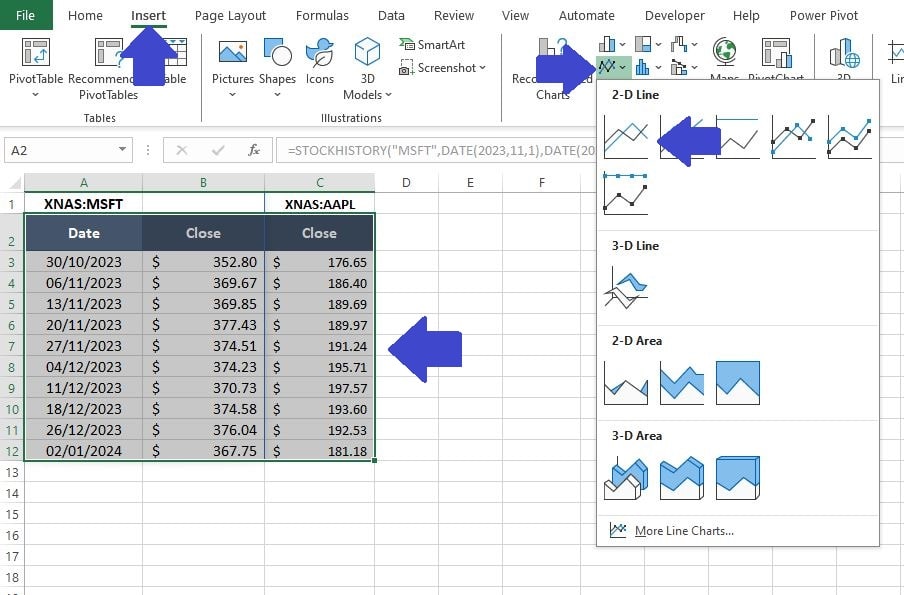
With the price history for Microsoft and Apple stock is side-by-side it becomes easy to perform some additional analysis. For example you might decide to complete a standard line chart to compare the two stocks visually:
- Select your data (cells A2 to C12 in this example).
- Click on ‘Insert‘ on the Excel Ribbon then select a ‘2-D Line Chart‘.
Alternatively, if you’re interested in seeing how Microsoft and Apple stocks affect each other, you might want to try a correlation analysis. This is a way to see if the prices of these two stocks move together.
If you’d like to learn how to do this in Excel, we have a great post called ‘How to Calculate Correlation Coefficients in Excel.’ It uses Microsoft and Apple stock prices as an example and explains everything in easy steps, perfect if you’re new to this kind of analysis.
Scenario 3: Retrieving Specific Data Types to Create a Candlestick Chart
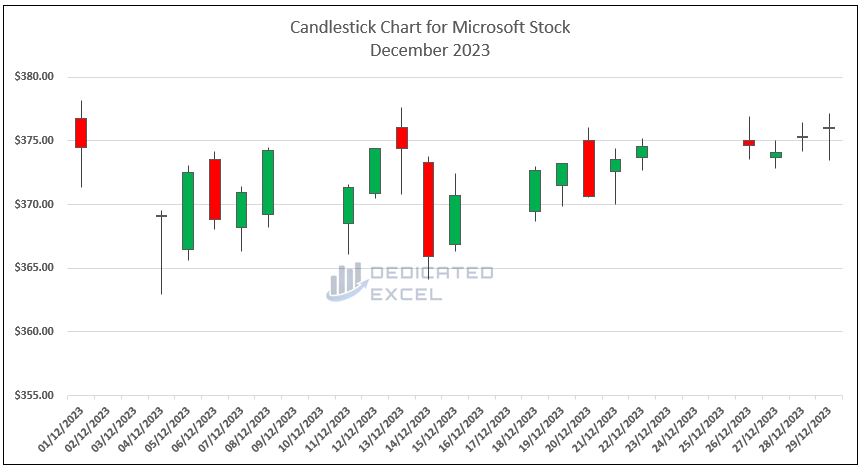
In our third scenario, let’s harness the power of Excel’s STOCKHISTORY function to gather the precise data needed for crafting a Candlestick Chart. The Candlestick chart is commonly used in financial and stock market analysis. It provides detailed information about price movements over a period, showing the open, high, low, and close prices.
Each “candlestick” typically has a wide part, called the “real body,” which represents the range between the opening and closing prices, and thinner lines above and below, called “wicks” or “shadows,” representing the high and low prices. These charts are valuable for traders to analyse market sentiment and price patterns.
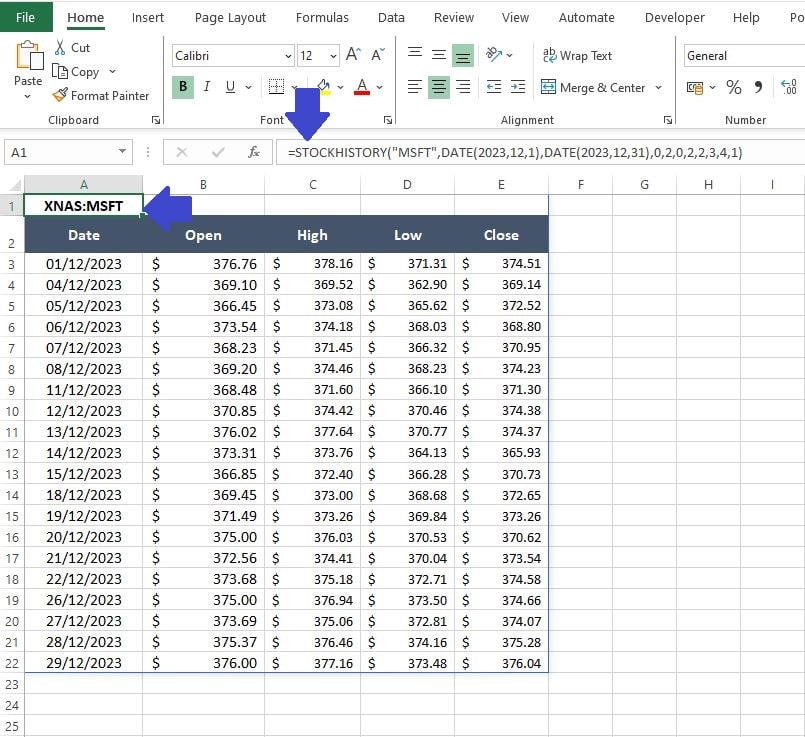
First in cell A1 we can use the following formula to return the daily opening price, high price, low price and closing price for Microsoft’s stock in December 2023.
- =STOCKHISTORY(“MSFT”,DATE(2023,12,1),DATE(2023,12,31),0,2,0,2,2,3,4,1)
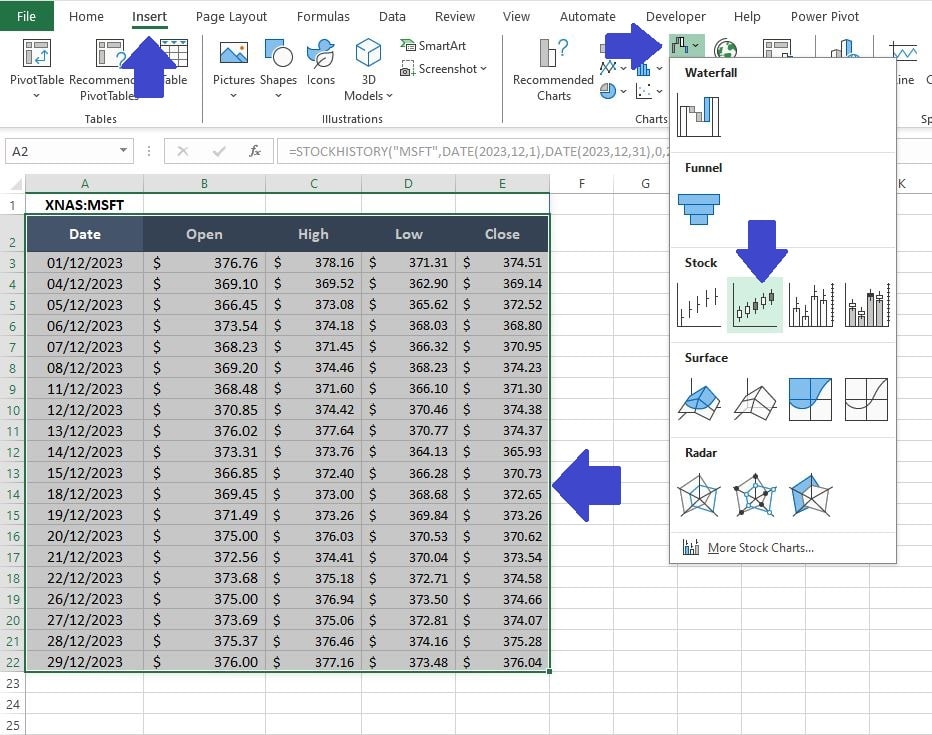
The next step is to Insert the Candlestick Chart, follow these steps:
- Select your data (cells A2 to E22 in this example).
- Click on ‘Insert‘ on the Excel Ribbon then select the ‘Open – High – Low – Close‘ chart from the Stocks Chart menu,
Scenario 4: Create a Stock Query Tool
In this final section, we’ll explore how to use Excel’s STOCKHISTORY function to create a straightforward stock query tool. This tool is perfect for anyone who regularly checks various stock prices and prefers analysing them in Excel. The advantage of using Excel is its flexibility – when you spot a potential investment opportunity, you can dive into the finer details right there in your spreadsheet.
To begin:
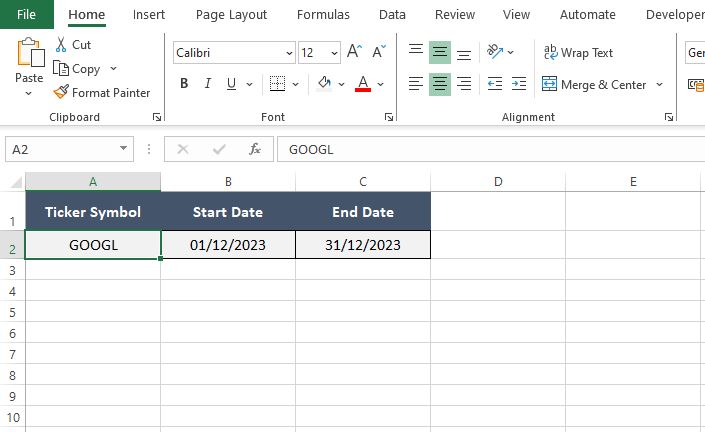
- Open a New Excel workbook.
- In cells A1 to C1, label them as ‘Ticker‘, ‘Start Date‘, and ‘End Date‘, respectively.
- In the second row (cells A2 to C2), we’ll input some sample data to demonstrate how the tool works.
For this example, we’re using Google’s stock, denoted by the ticker symbol ‘GOOGL‘. We’ll set the ‘Start Date‘ as December 1, 2023, and the ‘End Date‘ as December 31, 2023.
This setup will allow us to retrieve Google’s stock prices for the specified date range using the STOCKHISTORY function.
Moving forward, our next task is to craft a formula that effectively employs the STOCKHISTORY function in Excel, leveraging the data we’ve input in cells A2, B2, and C2.
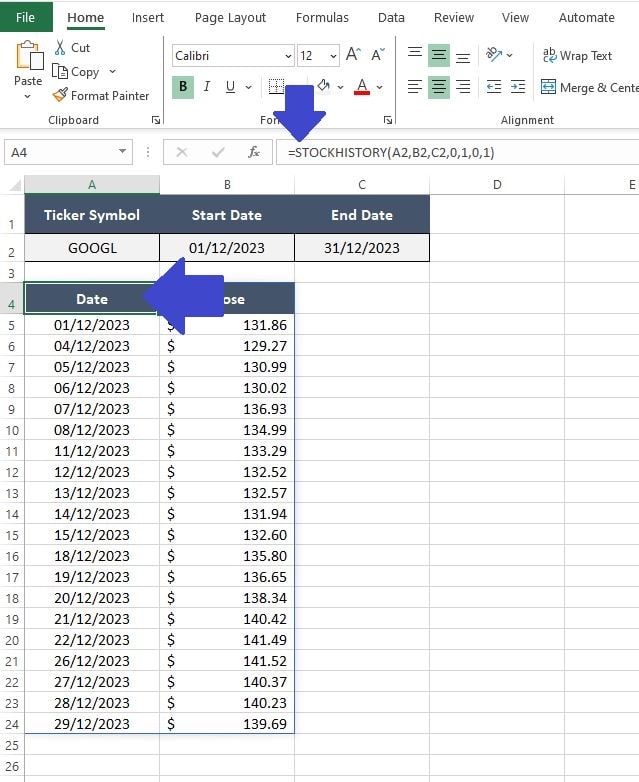
In cell A4, input the formula:
- =STOCKHISTORY(A2, B2, C2, 0, 1, 0, 1)
This formula is designed to fetch the daily closing prices of the stock identified in cell A2, spanning the date range specified in cells B2 (start date) and C2 (end date).
The configuration of the STOCKHISTORY function here ensures that we get precise and relevant data for our analysis, tailored to the dates we’re interested in.
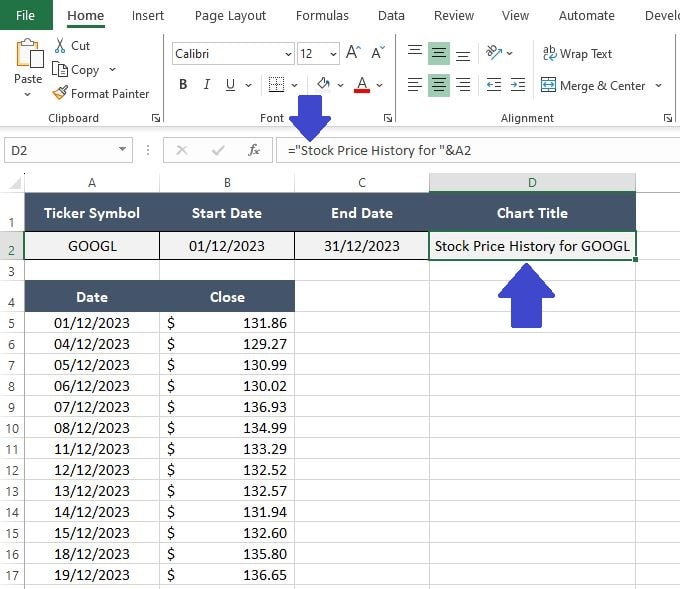
We can now build a price chart from the information. Let’s start by making sure we have an automated Chart Title available to us.
- Label cell D1 as ‘Chart Title
- In cell D2 enter the formula =”Stock Price History for “& A2
Now we can Insert a line chart as before:
- Select your data (cells A4 to B24 in this example).
- Click on ‘Insert‘ on the Excel Ribbon then select a ‘2-D Line Chart‘.
- Select the Chart Title which should be called ‘Close‘ and in the formula bar enter the formula = Sheet1!$D$2. Note the formula assumes your worksheet is called “Sheet1”, amend as required.
- You have now used Excel’s STOCKHISTORY Function to create your very own stock query tool!
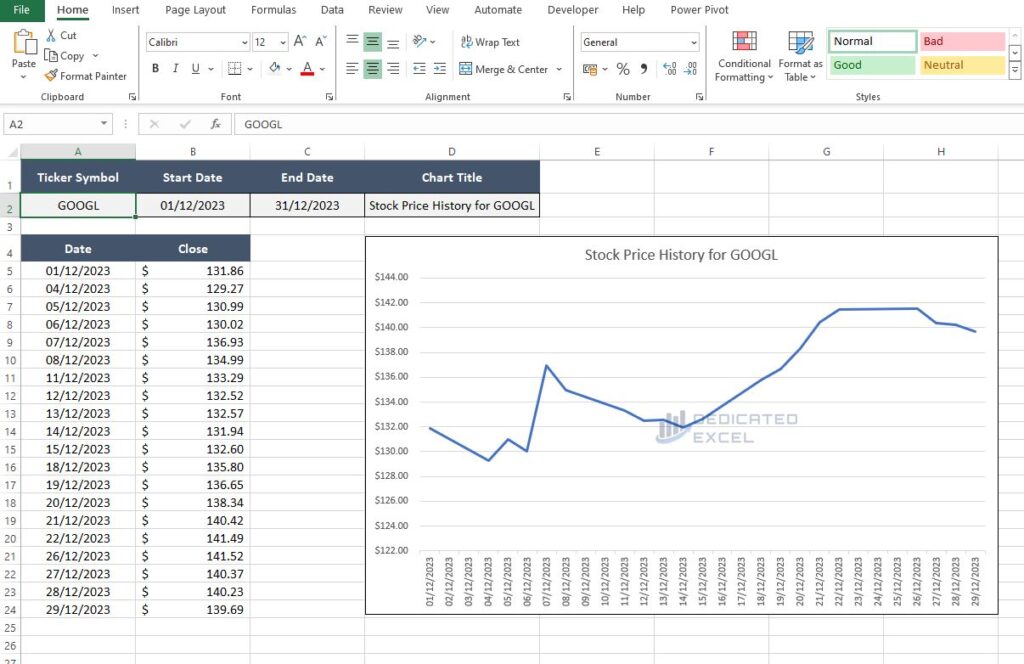
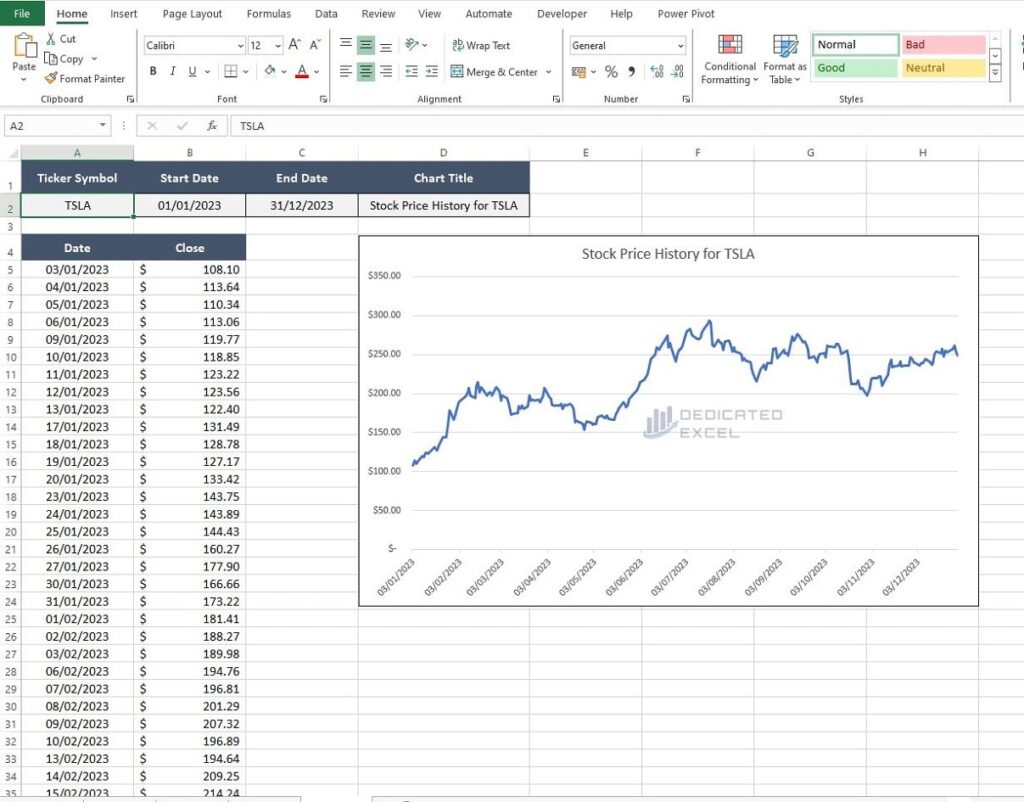
You can change the cells in A2, B2, and C2 and the price history along with the chart and title, will update automatically.
For example if you want to see the stock price for Tesla over the past 12 months all you need to do is:
- Change cell A2 to “TLSA“, the ticker symbol for Tesla.
- Change cell B2 to 1st January 2023.
- Leave cell C2 unchanged as 31st December 2023.
Additional Use Cases for Excel’s STOCKHISTORY Function
Now that you’ve mastered the basics of Excel’s STOCKHISTORY function through the four detailed scenarios, you might be wondering what else you can do with this versatile tool.
Here are some additional use cases that can further expand your financial analysis capabilities:
Historical Stock Performance Analysis
Use Excel’s STOCKHISTORY function to analyse the long-term performance of a stock. By pulling data from several years back, you can assess how a company’s stock has responded to market changes, economic cycles, or significant corporate events.
Seasonal Trend Analysis
Analyse stocks for seasonal trends by comparing performance during the same months across different years. This can be particularly useful in sectors that are sensitive to seasonal factors.
Technical Analysis for Trading
Advanced users can leverage Excel’s STOCKHISTORY function to perform technical analysis, such as calculating moving averages or other technical indicators that require historical price data.
Custom Stock Dashboard for Personal Portfolio Analysis
Another advanced application of Excel’s STOCKHISTORY function is creating a custom stock dashboard for analysing your personal investment portfolio. This dashboard can provide a comprehensive view of your investments, track their performance over time, and help in making informed decisions about your portfolio.
Summary
As we’ve explored throughout this post, the STOCKHISTORY function in Excel is a powerful tool for anyone looking to delve deeper into the world of stocks and investments. From analysing the historical performance of individual stocks to comparing multiple stocks and even creating your own stock query tool for personal analysis – we’ve covered a range of practical applications to get you started.
Remember, the examples provided are just the beginning. Excel’s STOCKHISTORY function opens up opportunities for you to conduct your own analyses, tailored to your unique investing interests and strategies. Whether you’re making decisions for long-term investment or daily trading, this function is an invaluable asset in your Excel toolkit.
Keep experimenting with the STOCKHISTORY function, and use it to uncover insights that could inform your investment choices. With these foundational skills, you’re now equipped to take your financial analysis to the next level.
Keep Excelling,

Prefer digital currencies over traditional money? For those interested in Cryptocurrencies like Bitcoin or Ethereum, don’t miss our guide on ‘How to Get Crypto Prices in Excel.’ It’s a straightforward resource for tracking your digital investments with ease.