
Have you ever stumbled upon a task that required a comprehensive list of the 50 US States in Excel? Imagine not only having this list at your fingertips but also the ability to transform it into a captivating, informative population map! I’m here to guide you through this journey, ensuring a smooth, educational experience.
As an Excel enthusiast, I know the importance of having accessible data. This post is dedicated to unveiling the potential of Excel’s Geography and Map features, starting with a simple list of the US States. Whether you’re a student, a data analyst, or just an Excel hobbyist, understanding these features can elevate your data presentation skills significantly.
Table of Contents
- What is a List of 50 US States in Excel?
- Why Have I Created this list of 50 US States in Excel?
- Download the List of 50 US States in Excel Format
- How Can You Use The List – Example
- Alternative Ideas for Utilizing the List of US States
- Summary
What is a List of 50 US States in Excel ?
The list of all 50 US States in Excel is specifically designed to seamlessly integrate with Excel’s Geography feature. This isn’t just a random assortment of state names; it’s a meticulously formatted dataset that perfectly aligns with Bing’s geographic data.
Why does this matter?
Because when your list matches Bing’s data, Excel’s Geography feature activates its full potential. By ensuring compatibility with Bing, this list becomes a powerful tool for geographical data analysis and visualization in Excel. It’s not just about having the names of the states; it’s about unlocking a world of geographic information – from population statistics to economic data – all readily accessible within Excel.
This list is your key to exploring and presenting data in ways that are both informative and visually appealing.
Why Have I Created a List of 50 US States in Excel?
Building an Excel Inventory Management tool for a client with outlets in all US States led me to a surprising discovery: there wasn’t a simple, Excel-ready list of the US States available.

I needed a straightforward list that could be easily dropped into Excel, but all I found were complex datasets or lists in non-Excel formats
Realizing the utility of such a list for not just my project but for others too, I created this easy-to-use, Excel-formatted list. It’s designed for quick integration into Excel projects, saving time and streamlining data management, whether for business, education, or personal use.
Download the List of 50 US States in Excel Format
You can choose from two options to get hold of the list, first you can download the Excel template containing the list by clicking on the button below:
Download List of US States in ExcelAlternatively, you can copy and paste the following Excel-Friendly list directly below:
State Name
Alabama
Alaska
Arizona
Arkansas
California
Colorado
Connecticut
Delaware
Florida
Georgia
Hawaii
Idaho
Illinois
Indiana
Iowa
Kansas
Kentucky
Louisiana
Maine
Maryland
Massachusetts
Michigan
Minnesota
Mississippi
Missouri
Montana
Nebraska
Nevada
New Hampshire
New Jersey
New Mexico
New York
North Carolina
North Dakota
Ohio
Oklahoma
Oregon
Pennsylvania
Rhode Island
South Carolina
South Dakota
Tennessee
Texas
Utah
Vermont
Virginia
Washington
West Virginia
Wisconsin
Wyoming
How Can You Use The List of US States?
I’m not just here to hand over a list; my goal is to help you master Excel! Now, let’s explore an exciting example of how this list of all 50 US states, perfectly formatted for Excel, can be transformed into a practical project.
Together, we’re going to create a population heat map of the US.
This project will leverage our raw data file, alongside Excel’s powerful Geography Data Type and Maps Feature, to bring the data to life visually. Let’s dive in and see how your Excel skills can illuminate insights from raw data.
Step 1: Preparing Your Data
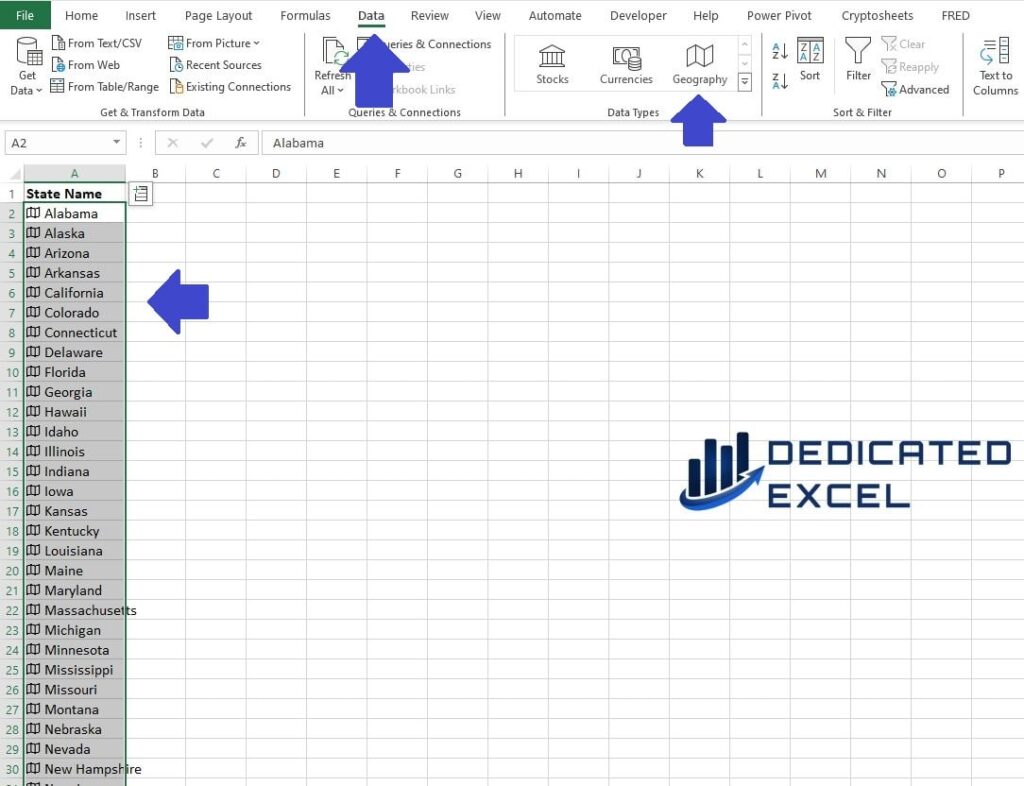
- Start with Your State List: Ensure your list of the 50 US States is in cells A1 to A51, with the header in A1.
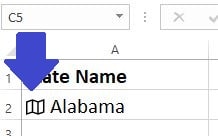
- Activate the Geography Data Type: Click on cell A2, drag down to A51 to highlight all the state names. Go to the “Data” tab on the ribbon and click “Geography” in the “Data Types” group. Excel will convert these names into rich, geographical data.
Step 2: Adding Population Data
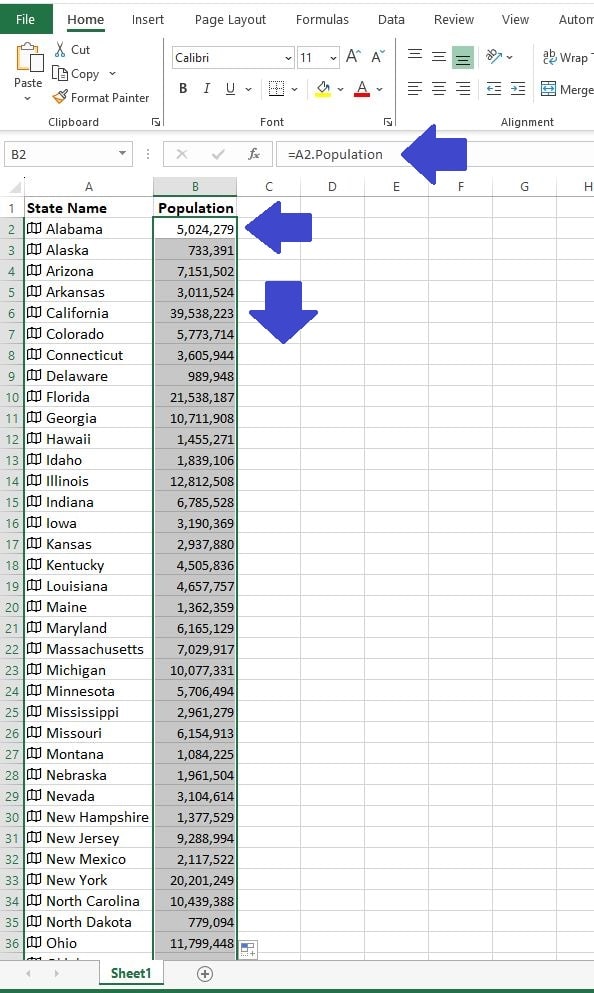
- Enter Column Header: Type the header “Population” in cell B1.
- Extract Population Data: In cell B2, type “=A2.Population” and press Enter. Excel will display the population for the first state.
- Fill Down the Formula: Drag the bottom right corner of cell B2 down to B51 to apply this formula to all states.
Step 3: Creating the Heat Map
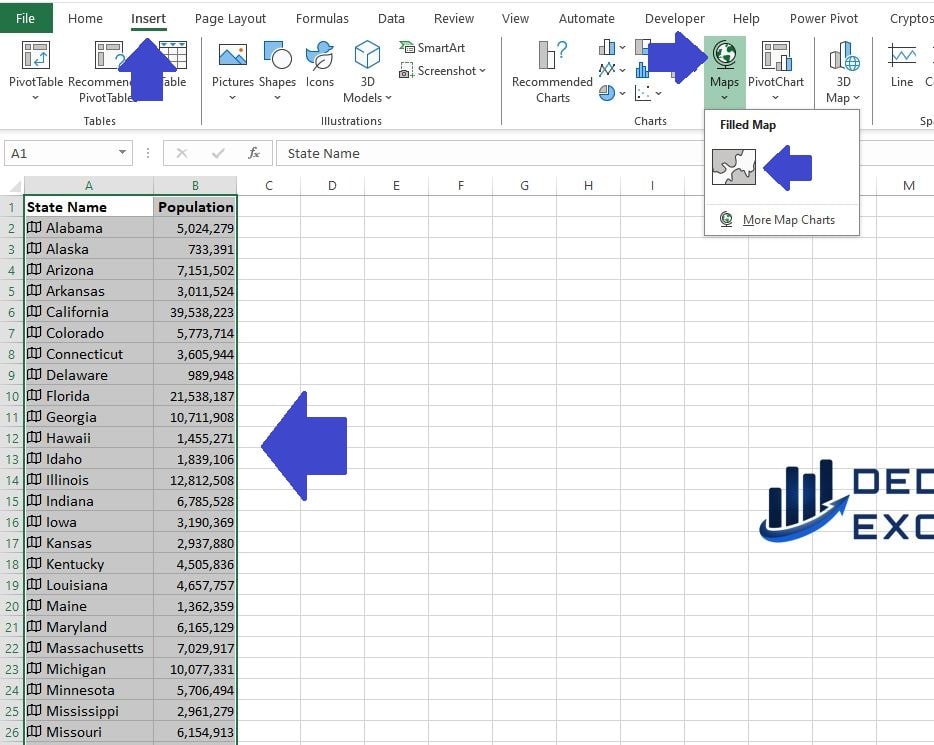
- Select Your Data: Click and drag to select cells A1 through B51.
- Insert a Map Chart: Go to the “Insert” tab, click “Maps” and choose “Filled Map”. Excel will generate a heat map based on the population data, with states having larger populations displayed in a darker shade.
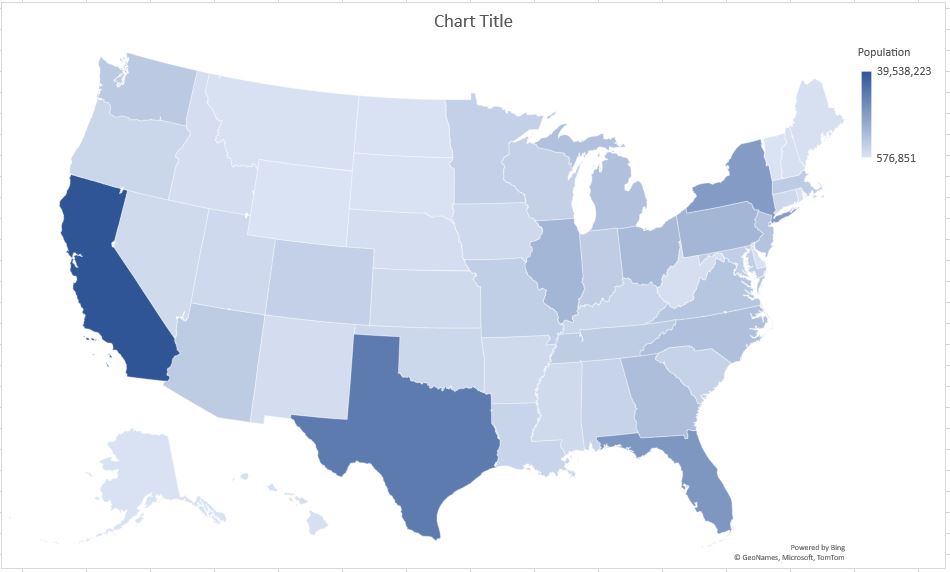
Step 4: Customizing the Map
Our US Population Distribution Heat Map has now been created, however we can improve the look with some basic formatting.
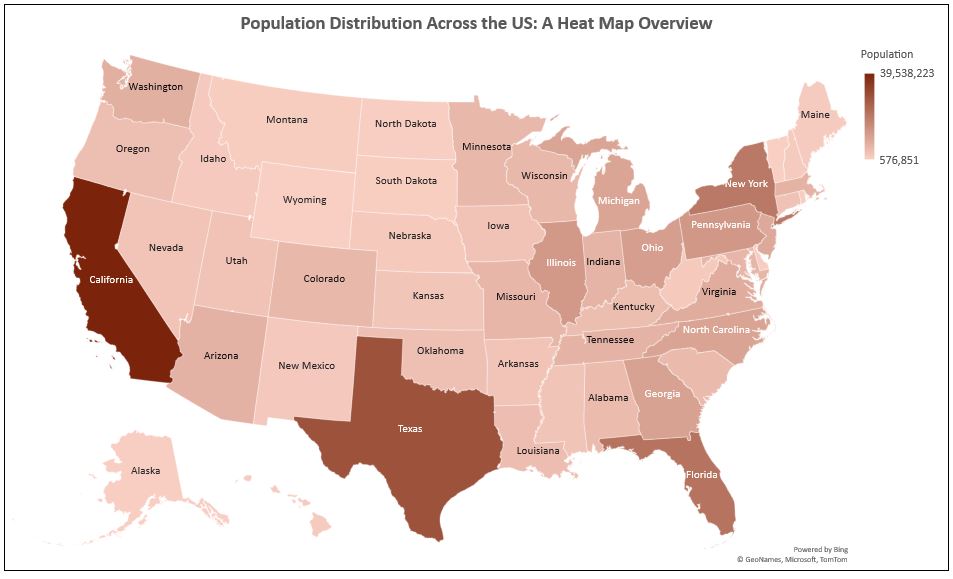
- Edit the Chart Title: Click on the ‘Chart Title‘ to select it, then edit the text with “Population Distribution Across the US: A Heat Map Overview“.
- Adjust the Colour Scheme: Select ‘Page Layout‘ from the Excel Ribbon then in the ‘Themes‘ sub menu select ‘Colors‘ and choose “Red“
- Fine-Tune the Chart Labels: You can also adjust data labels by clicking “Chart Elements” (the plus icon next to the map) and ticking “Data Labels”.
Our Population Distribution Heat Map now looks a lot more professional. You can play around with additional elements to get the chart’s look to suit your own requirements.
Step 5: Interpreting the Map
We can now take a look at what we have created and interpret the results:
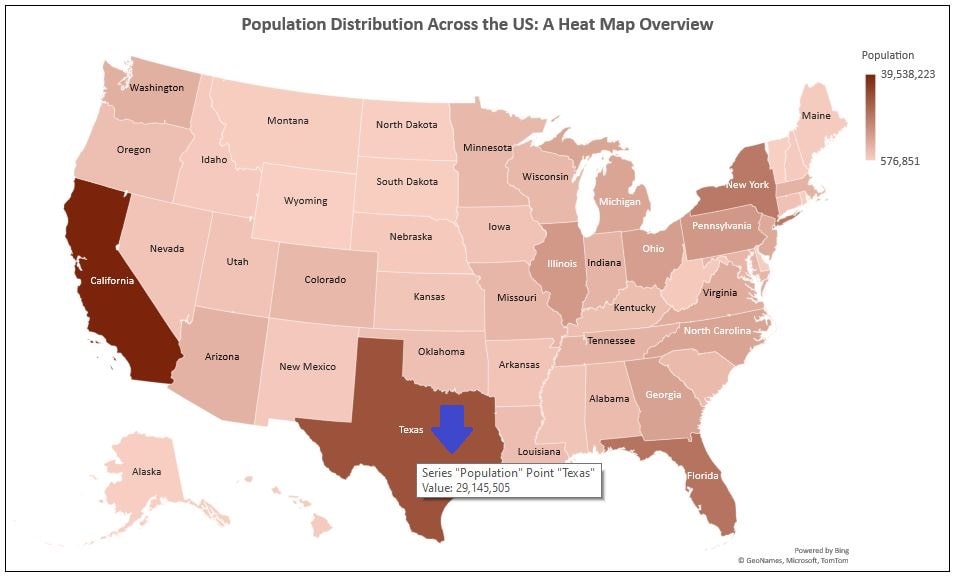
- Analyse the Data Visually: The heat map provides a visual representation of population distribution across the US.
- Darker states have higher populations, offering an immediate sense of demographic spread.
- Darker states have higher populations, offering an immediate sense of demographic spread.
- Hover for Details: Moving your cursor over each state on the map will show the specific population data, allowing for a detailed analysis.
Alternative Ideas for Utilizing the List of US States
This list of the 50 US States in Excel is a versatile tool with applications extending far beyond population maps. Its simplicity and adaptability make it a valuable asset for various projects and analyses. Here are some creative ways to utilize this list:
- Sports Analytics
- Perfect for sports enthusiasts or analysts, this list can be used to track and compare college football records, player statistics, or team performances state-wise. Imagine mapping out the most successful states in college football or analysing regional differences in player statistics.
- Educational Tools
- Teachers can leverage this list for creating geography quizzes, history lessons about states, or even math problems based on state-specific data. It’s an excellent resource for interactive and engaging classroom activities.
- Business Analysis
- Businesses can use this list to plot sales data, analyse market trends, or track the performance of outlets across different states. It’s ideal for visualizing market penetration or planning expansion strategies.
- Public Health Studies
- Public health professionals can utilize this list for mapping health statistics like vaccination rates or tracking disease spread patterns across states. This could aid in understanding regional health disparities or the impact of health policies.
- Travel Planning
- For travel enthusiasts, this list can help in planning road trips, marking out destinations, or even creating a checklist of states visited. It’s a handy tool for anyone looking to explore the diversity of the US.
- Cultural Surveys and Studies
- Researchers or sociologists can use the list to analyse cultural trends, survey results, or demographic changes across the states. This could provide insights into regional cultural differences or shifts in population dynamics.
Each of these ideas showcases the multifaceted uses of a simple Excel list of US States, proving that sometimes the most basic tools can have the most wide-ranging applications.
Summary
In wrapping up, I’m delighted to have shared a resource that I trust will prove immensely valuable: a meticulously prepared list of the 50 US States, formatted for seamless integration with Excel. This list is available for direct download or can simply be copied and pasted from the post—whichever suits your workflow best.
Beyond just providing the list, we’ve ventured further into the practical uses of Excel. By guiding you through the creation of a population heat map, we’ve demonstrated how to harness this list for vivid data visualization. Whether for educational purposes, business analysis, or personal projects, the application of this tool is as varied as it is valuable.
Remember, Excel is more than a spreadsheet application; it’s a canvas for data storytelling, where numbers transform into insights.
Keep Excelling,

If you’ve mastered plotting the 50 US states on a map in Excel, it’s time to take your skills a notch higher. “How to Use Business Assist Forecast Excel Add-In” is your next stop.
This guide will elevate your Excel journey, intertwining the precision of data forecasting with the simplicity you enjoyed while mapping the US states.
With Business Assist Forecast, you’re not just learning another Excel function; you’re unlocking a future of insightful, data-driven decisions. Whether you’re a business owner, a student, or an Excel enthusiast, understanding how to use this add-in is a game-changer.