
Do you watch stock market analysts with their complex charts and wonder how they make sense of it all? Today, I’m going to let you in on one of their secrets: the Relative Strength Index (RSI), a powerful tool that can be easily calculated in Excel. This indicator isn’t just for financial wizards; with this guide, you’ll learn How to Calculate RSI in Excel and harness its power for your own analysis.
Table of Contents
- What is Relative Strength Index (RSI)?
- Why Calculating RSI is Useful in Investing and Trading Decisions
- How to Calculate RSI in Excel
- Charting the RSI Trend in Excel
- Adapting RSI for Different Markets
- Further Enhancements to RSI Calculations in Excel
- Summary

What is Relative Strength Index (RSI)?
The Relative Strength Index, commonly known as RSI, is a pivotal tool in the universe of technical analysis for stock markets and other financial markets. At its core, RSI is a momentum oscillator that measures the speed and magnitude of price movements. Developed by J. Welles Wilder Jr. in 1978, it’s presented as an index ranging from 0 to 100, designed to track the velocity of price changes.
RSI calculation typically uses a fixed period of 14, which can be days, weeks, or months, depending on the intended analysis timeframe. The indicator oscillates between two key levels: 70 and 30. An RSI reading above 70 indicates that an asset may be overbought – suggesting a potential price drop, whereas a reading below 30 suggests that an asset might be oversold, hinting at a potential price rise.
This indicator’s versatility allows it to be applied across various markets, including stocks, commodities, indices, and currencies. It’s particularly favoured for its simplicity and effectiveness in highlighting potential price reversals or confirming existing trends.
Why Calculating RSI is Useful in Investing and Trading Decisions
Calculating RSI plays a significant role in refining investment or trading decisions. Here’s how:
- Spotting Overbought and Oversold Conditions: By identifying when an asset is overbought or oversold, RSI helps traders anticipate potential reversals. For instance, an overbought condition could signal a selling opportunity, while an oversold condition might indicate a buying opportunity.
- Confirming Trend Strength: RSI can also be used to assess the strength of a current trend. Stable, high RSI values during an uptrend, or stable, low RSI values during a downtrend, can confirm the trend’s strength, suggesting it may continue.
- Identifying Divergences: Sometimes, the asset price may make new highs or lows without the RSI doing the same. This divergence can be a powerful indicator of a weakening trend and a potential reversal.
- Timing Entries and Exits: By setting specific RSI thresholds, traders can develop criteria for entering or exiting positions. For example, entering a trade when the RSI moves out of an oversold condition and exiting when it reaches an overbought condition.
- Combining with Other Indicators: RSI is most effective when used in conjunction with other technical analysis tools, such as moving averages or Bollinger Bands, to provide a more comprehensive view of the market.
In essence, RSI serves as a key gauge for market sentiment, assisting investors and traders in making more informed decisions by adding a layer of quantitative analysis to their market assessments.
However, it’s crucial to remember that while RSI is a powerful tool, it should not be used in isolation. Integrating RSI readings with other market analysis forms, including fundamental analysis, provides a more balanced and robust investment or trading strategy.
How to Calculate RSI in Excel
In order to calculate RSI in Excel there are several steps to follow. This might seem a little intimidating for those of you with less Excel experience, but fear not! I’ll walk you through each step so you understand what you are doing and why you are doing it so you don’t miss a trick!
Data Preparation
To begin, gather a year’s worth of past closing prices for the asset you’re looking at. Although the basic RSI calculation requires just 14 days’ data, using 12 months gives you a more reliable view of how RSI trends over time. This is a good amount to start with, but feel free to adjust the data range based on what you need.
You can get this historical price data from financial websites or, if you’re using a recent version of Excel, the STOCKHISTORY function can fetch the data for you. We’ll use the STOCKHISTORY function in this example, if that’s new to you then check out our guide on How to Unleash Excel’s STOCKHISTORY Function to learn more.
Free Calculate RSI in Excel Template
If you have your own data that’s great. If you want to follow along using the STOCKHISTORY function then proceed. Alternatively you can download our Calculate RSI in Excel spreadsheet template.
Download Calculate RSI in Excel TemplateFirst, open up Excel. In cell A5 enter the following formula to return the ‘Date‘ and ‘Closing Price‘ for Tesla stock in 2023.
- =STOCKHISTORY(“TSLA”, DATE(2023,1,1), DATE(2023,12,31), 0, 1, 0, 1)
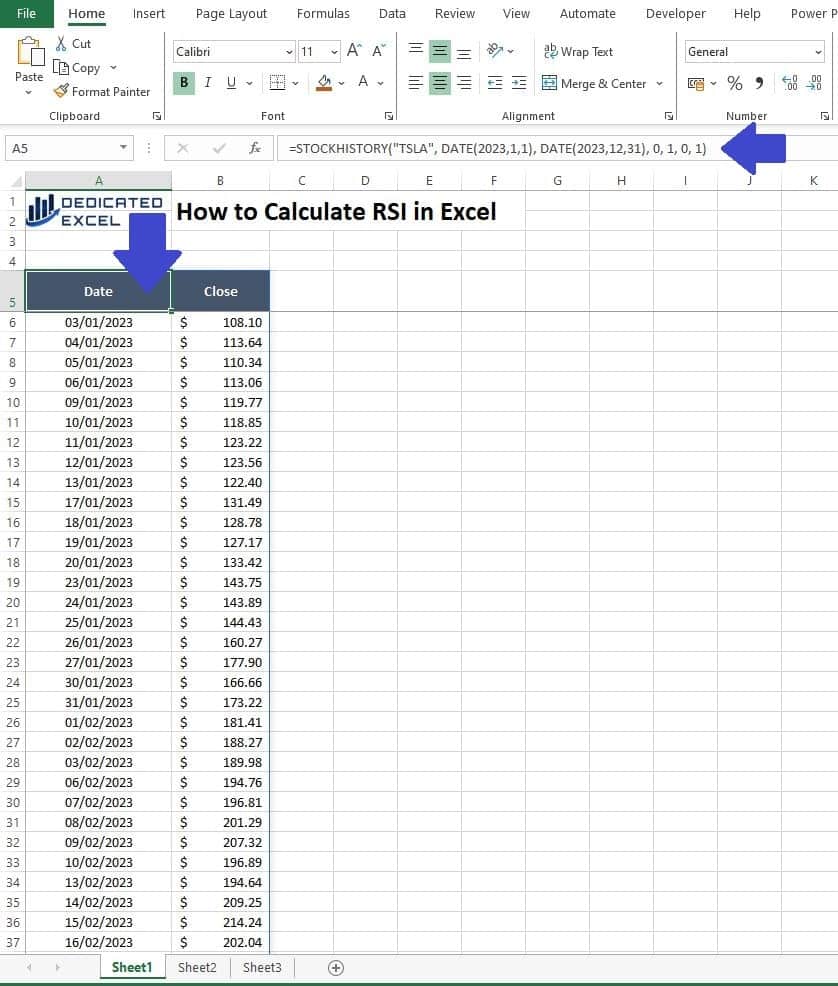
Remember to ensure your data is organized in Ascending order (oldest to newest). This is the standard way to calculate RSI in Excel and will ensure the formulas in the next step work correctly.
RSI Calculations
The next step is to calculate all the elements that go into determining the Relative Strength Index (RSI).
Daily Price Changes (Column C)
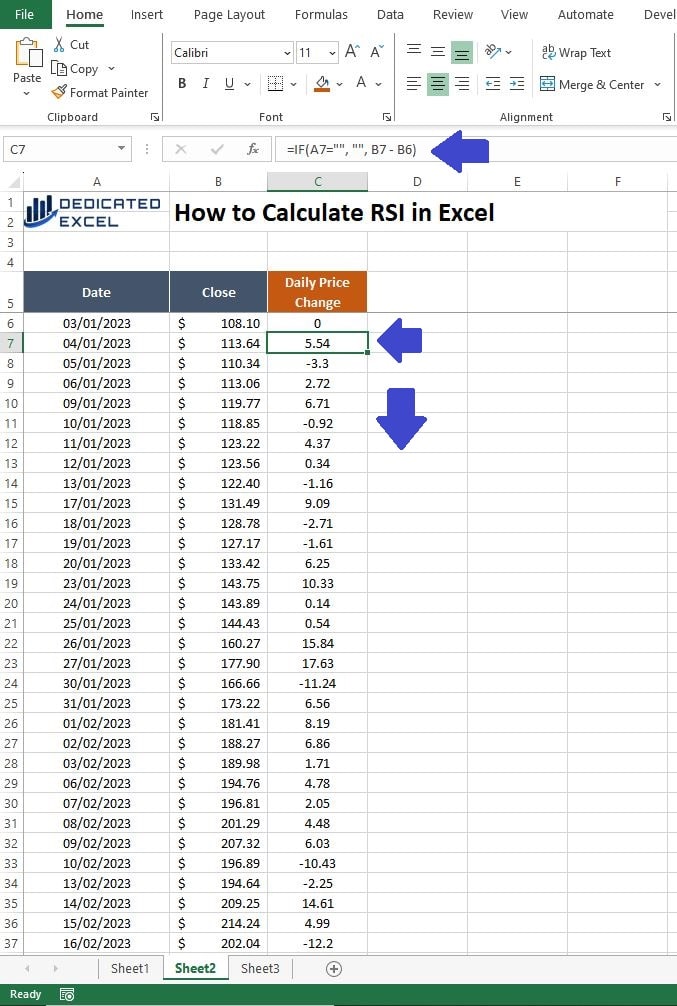
First we calculate the Daily Price Change in Column C.
- Header: In cell C5, type “Daily Price Change“.
- Formula: In cell C6, enter the value 0 (zero), This is because there can be no price change on the first observation.
- Formula: In cell C7, enter the formula =IF(A7=””, “”, B7 – B6).
- Action: Drag this formula down from cell C7 to the end of your data to calculate the daily price change for each day.
Gains (Column D)
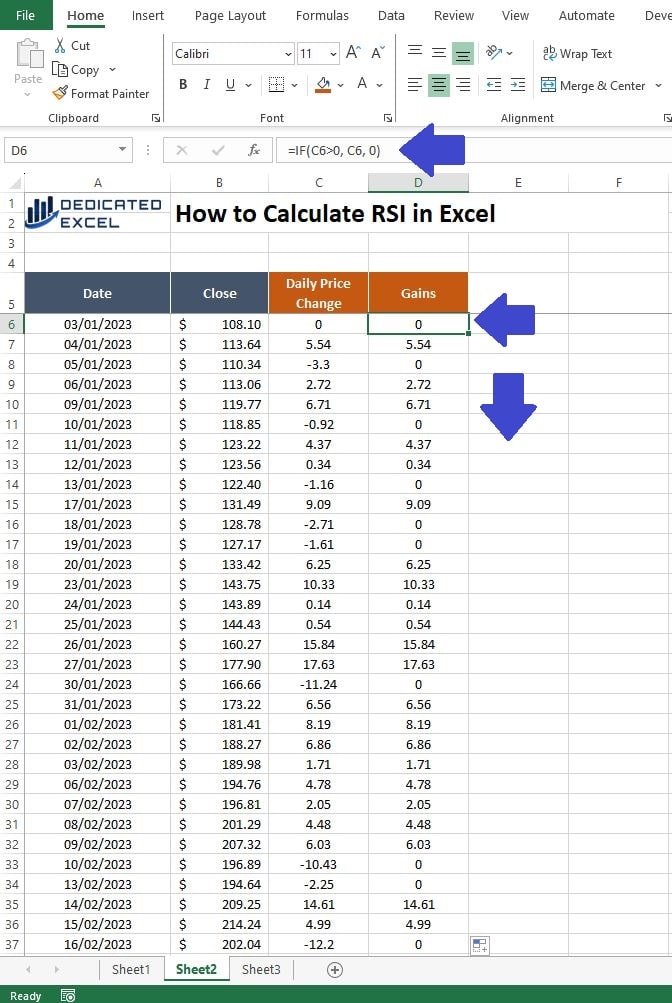
In Column D, we’ll calculate the Gains. This column will display the increase in the asset’s price from one day to the next (assuming there has been a gain).
- Header: In cell D5, type “Gains“.
- Formula: In cell D6, enter =IF(C6>0, C6, 0).
- Action: Drag this down to apply it to all rows of data.
Losses (Column E)
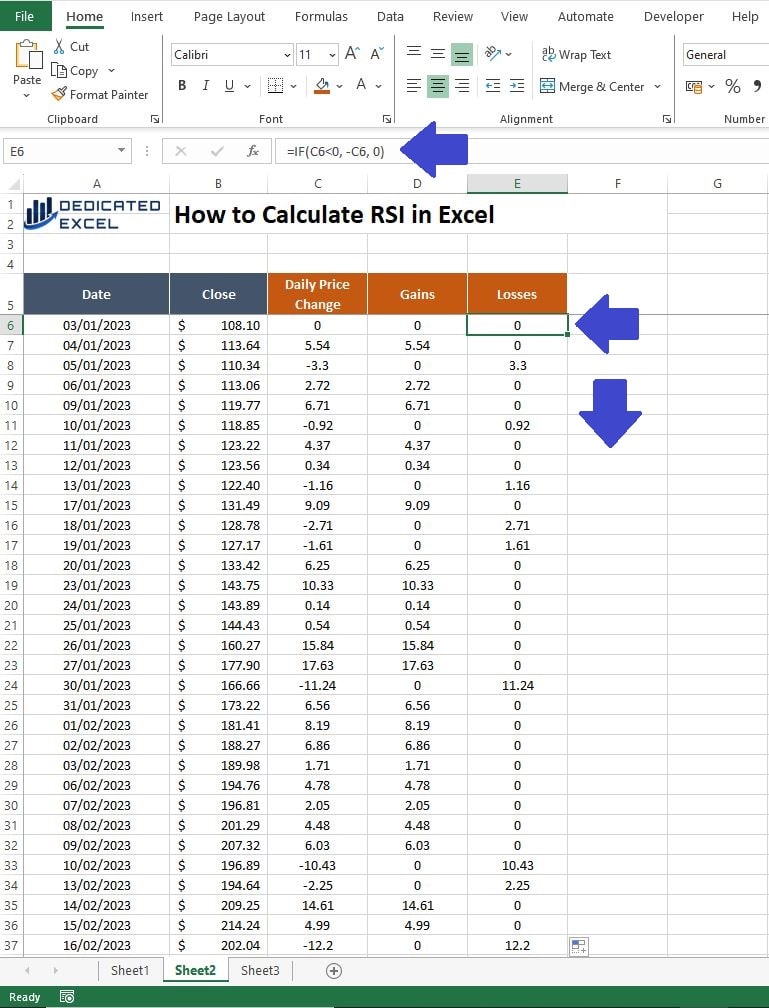
Next, in Column E, we’ll calculate the Losses. This column will display any decrease in the asset’s price from one day to the next. Note that the decrease in price will appear as a positive value, this is intentional for the RSI calculations.
- Header: In cell E5, type “Losses“.
- Formula: In cell E6, enter =IF(C6<0, -C6, 0).
- Action: Drag this down as well.
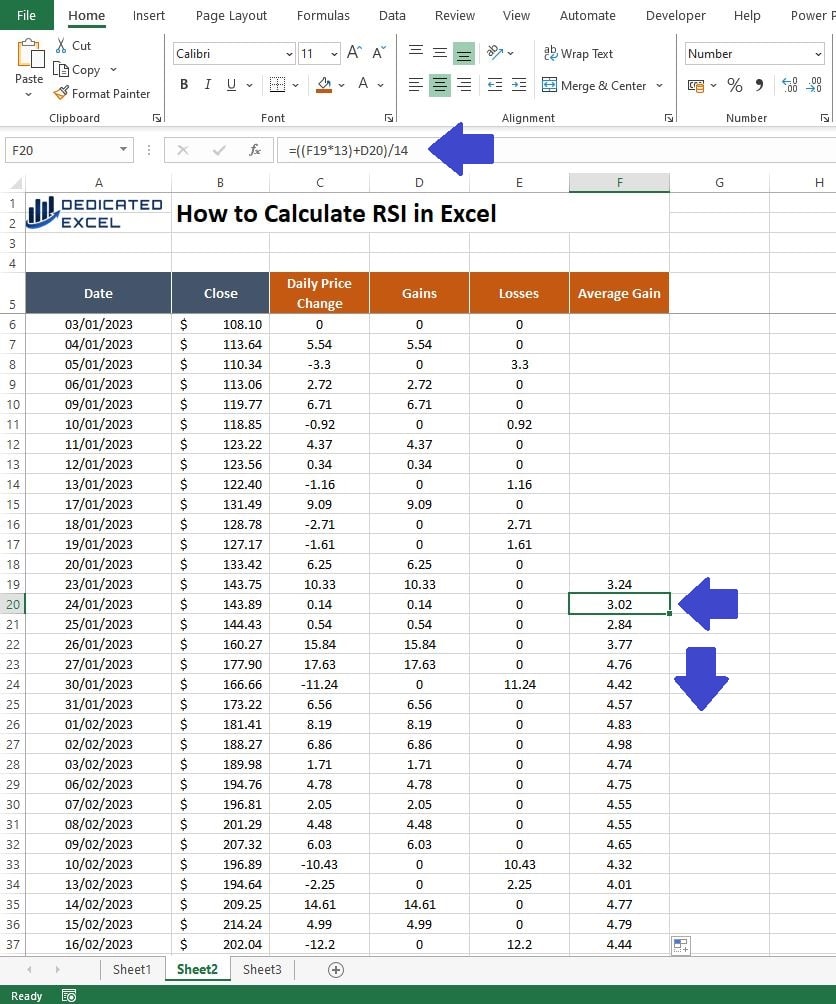
Average Gain (Column F)
This calculation is a two-step process. First, we determine the average gain over the initial 14-day period. Then, we update this average daily to reflect how each day’s gain affects the rolling 14-day average.
- Header: In cell F5, type “Average Gain“.
- Initial Formula for First 14 Days: In cell F19, enter =AVERAGE(D6:D19).
- Formula for Remaining Days: In cell F20, enter =((F19*13)+D20)/14.
- Action: Drag the formula down from cell F20 to the end of your data.
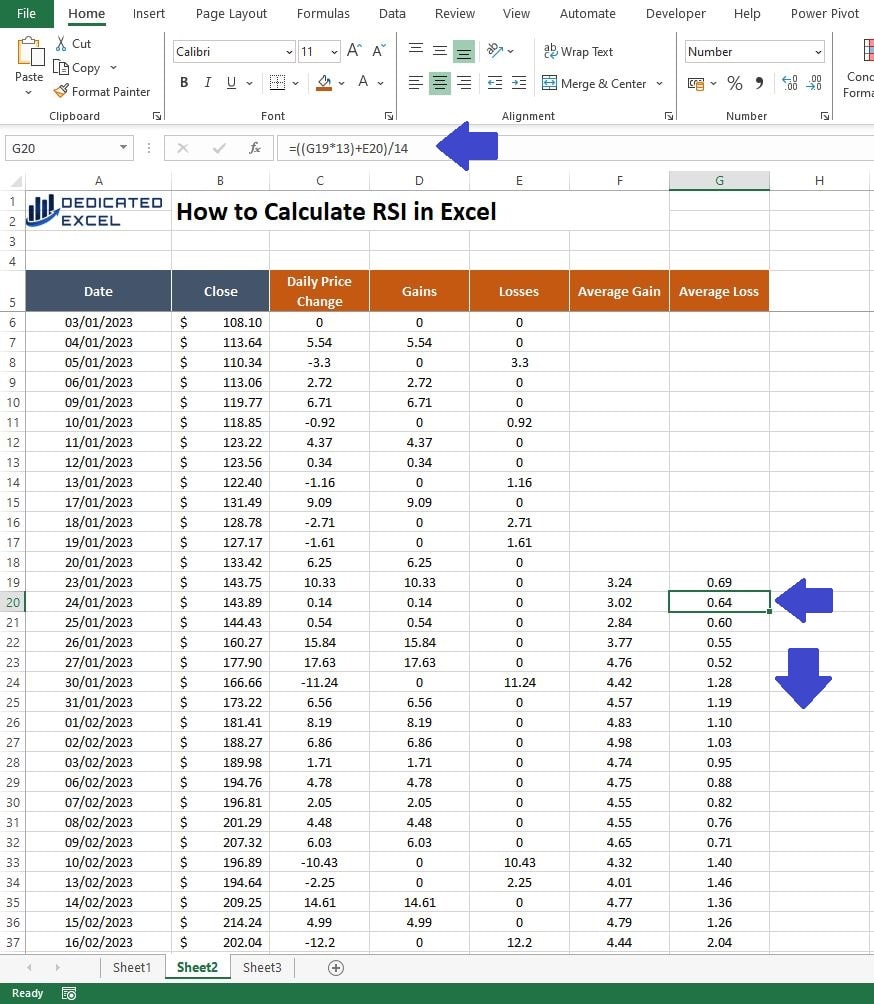
Average Loss (Column G)
Now we repeat the previous two-step process in order to calculate the Average Loss in Column G.
- Header: In cell G5, type “Average Loss“.
- Initial Formula for First 14 Days: In cell G19, enter =AVERAGE(E6:E19).
- Formula for Remaining Days: In cell G20, enter =((G19*13)+E20)/14.
- Action: Drag the formula down from cell G20 to the end of your data.
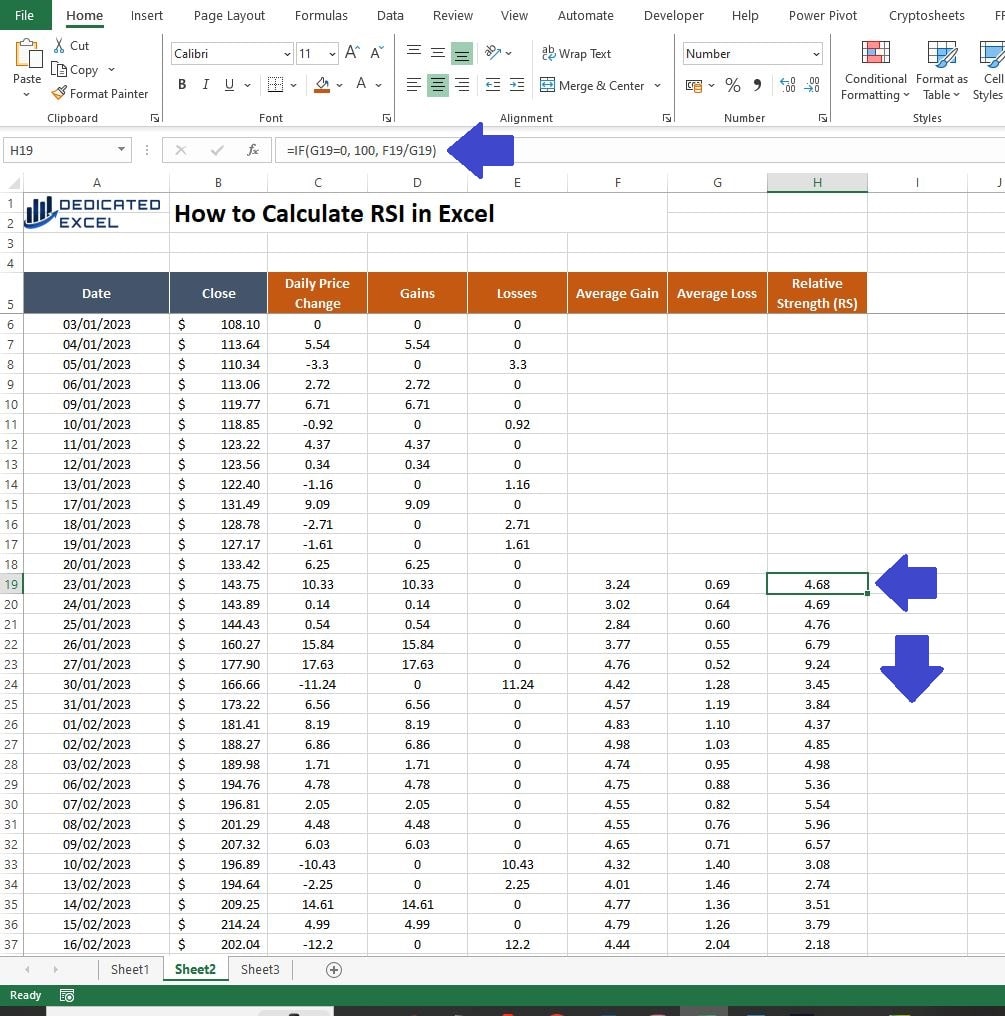
Relative Strength (Column H)
We’re nearing the end with just a couple more steps! In Column H, we calculate the Relative Strength. This measure reflects the momentum of price movements by comparing the average gains and losses over our chosen period.
- Header: In cell H5, type “Relative Strength (RS)“.
- Formula: In cell H19, enter =IF(G19=0, 100, F19/G19).
- Action: Drag this formula down from H19 to the end of your data.
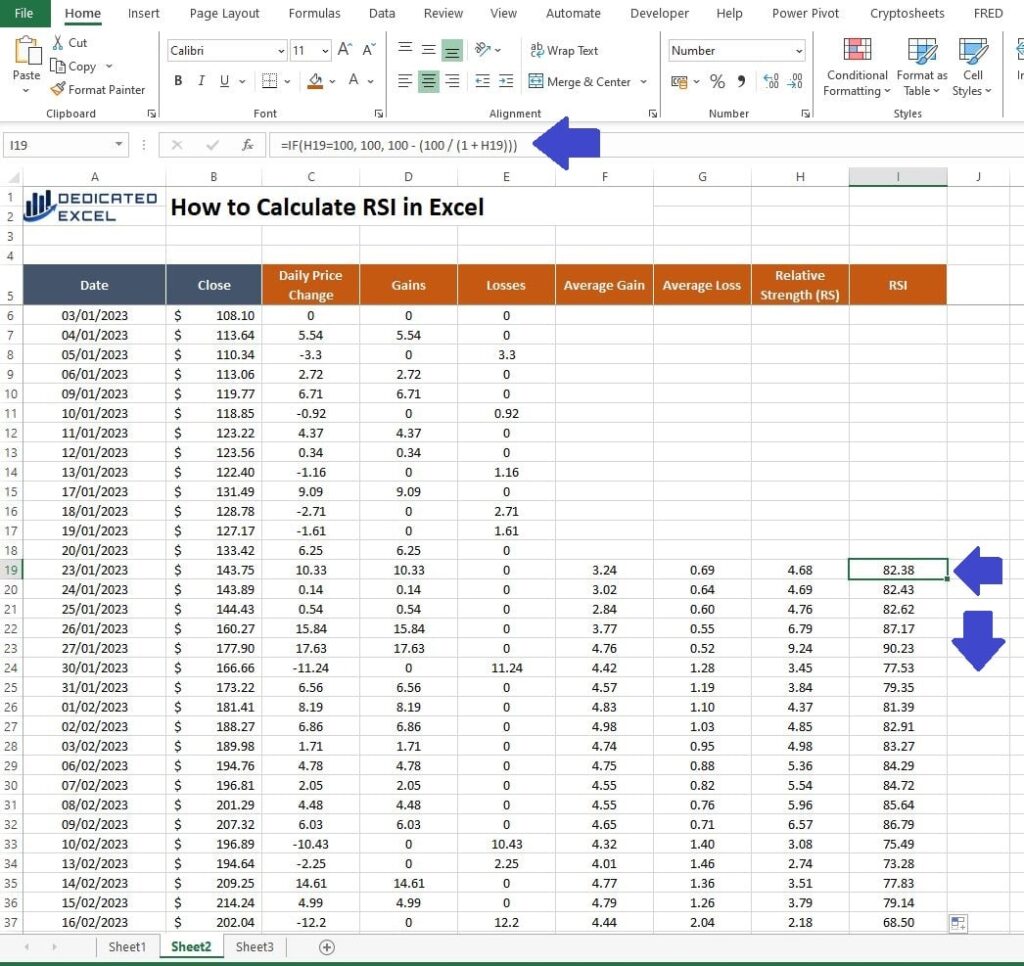
Relative Strength Index – RSI (Column H)
We are now ready to calculate the Relative Strength Index (RSI) in Column I. This calculation involves a specific formula that takes into account the Relative Strength we determined earlier. The RSI will provide us with a numerical value, ranging from 0 to 100, indicating whether the asset might be overbought or oversold.
- Header: In cell I5, type “RSI“.
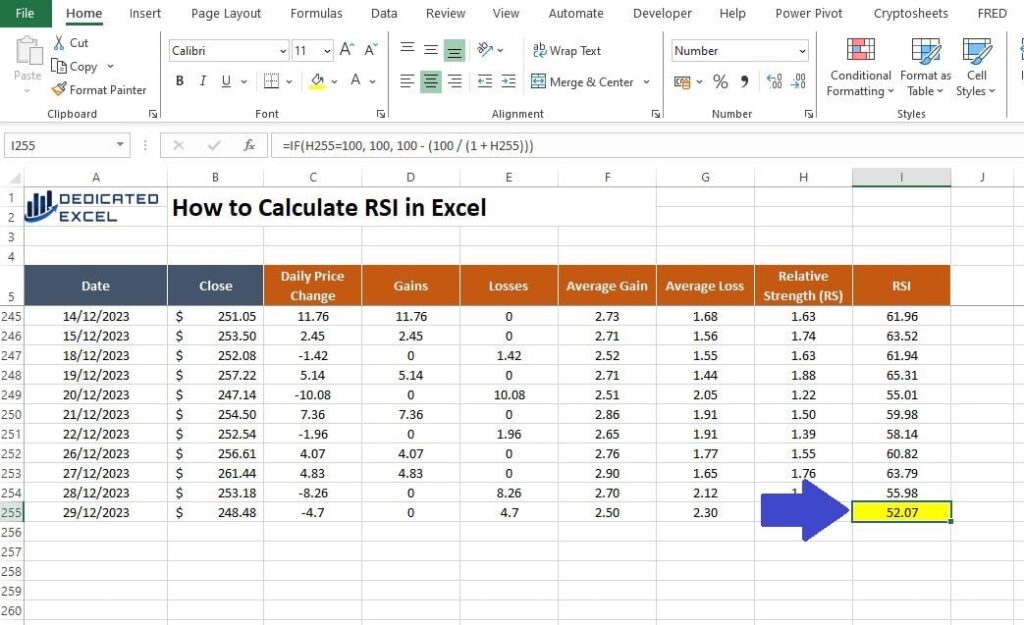
- Formula: In cell I19, enter =IF(H19=100, 100, 100 – (100 / (1 + H19))).
- Action: Drag this down from I19 to the end of your dataset.
RSI Calculation Result
Now that we’ve finished our calculations, you can scroll down to the latest entry in your dataset to see the most recent RSI value. For instance, in our example, the 14-day RSI for Tesla Stock on the 29th December 2023, which is the last trading day of the year, stands at 52.07.
The RSI value of 52.07 for Tesla Stock on the 29th of December 2023 suggests a neutral market condition. In RSI terms, a reading between 30 and 70 typically indicates that the stock is neither significantly overbought nor oversold. Here’s what this particular figure implies:
- Neutral Territory: An RSI close to 50, like 52.07, is considered neutral, indicating that the forces of supply and demand are relatively balanced at that moment.
- No Strong Price Momentum: This RSI value does not point towards strong bullish (upward) or bearish (downward) momentum. Instead, it suggests that the stock is currently in a stable condition without significant price movements in either direction.
- Wait for Further Signals: For investors or traders using RSI as part of their strategy, a value around 52 would typically mean a wait-and-watch approach is appropriate. It’s often considered prudent to look for additional signals or wait for the RSI to move into either the overbought (above 70) or oversold (below 30) zones before making trading decisions.
In summary, an RSI of 52.07 does not, by itself, strongly suggest a buy or sell action. Instead, it indicates a state of equilibrium in the stock’s price, and further analysis or additional indicators might be needed for a clearer trading or investment decision.
Charting the RSI Trend in Excel
One great benefit of the way we’ve set up our RSI calculations is how easily we can turn this data into clear, visual charts. These visuals can really help in spotting patterns and understanding trends better.
Create the Initial Line Chart
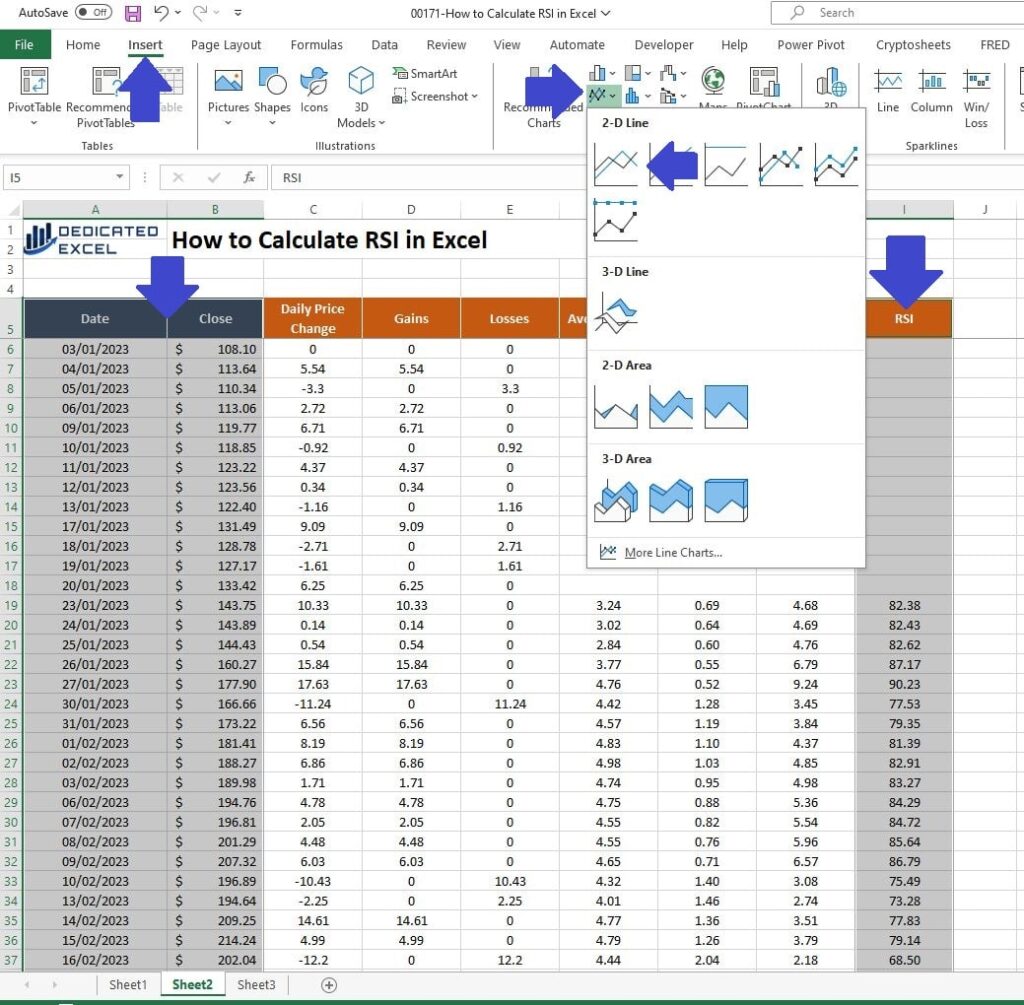
To create a line chart, first select your data in Column A (Date), Column B (Closing Price), and Column I (RSI). Here’s how you do it smoothly: click and drag to highlight Columns A and B first. Then, while holding down the CTRL key, click and drag to select the data in Column I.
Next, go to the Insert Menu on the Excel Ribbon, look for ‘Insert Line or Area Chart‘, and choose the ‘2D-Line‘ option. This will turn your selected data into a neat line chart, making it easier to see how the RSI correlates with the stock’s closing prices over time.
Format the Line Chart
Lets make our RSI chart in Excel look more professional:
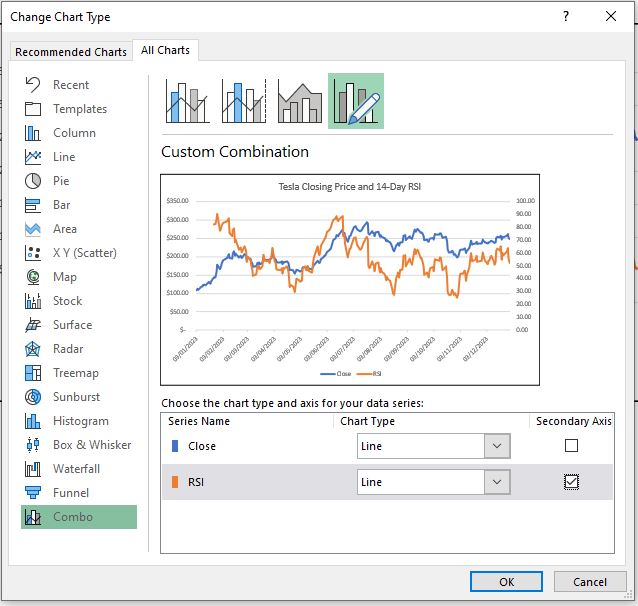
1. Convert RSI to the Secondary Axis
Right-Click on the RSI line in the chart and select ‘Change Series Chart Type‘ . In the ‘Change Chart Type‘ box check the box adjacent to the RSI series name that says ‘Secondary Axis‘.
2. Add a Chart Title and Format Data Axis
We can complete a couple more tweaks to get the chart looking awesome:
- Click on the chart title and change the text to read “Tesla Closing Price and 14-Day RSI“.
- Right-Click on the Axis with Closing Prices (left-side) and select ‘Format Axis‘ then in the ‘Number‘ section change the decimal places to zero.
- Repeat the previous process for the RSI value Axis (right-side).
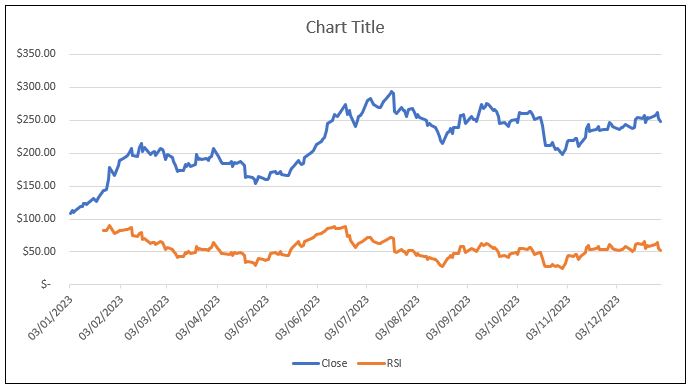
You now have a professional looking chart trending the Tesla Closing Price and 14-Day RSI.
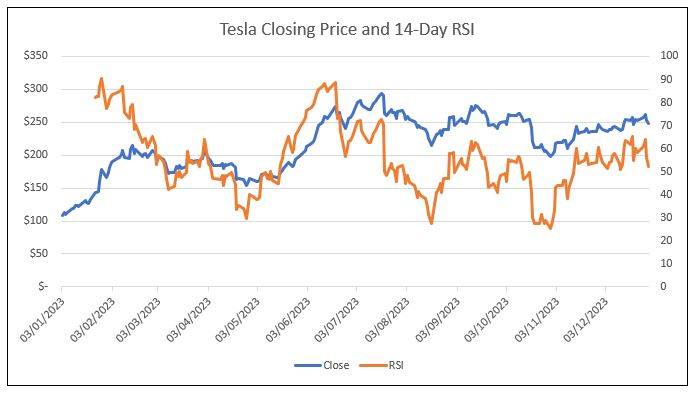
The chart effectively illustrates the relationship between the 14-Day RSI and the Closing Price over the past year. It provides a visual representation of key moments, particularly highlighting potential buying opportunities when the RSI dips below 30, indicating oversold conditions. By observing this, we can better understand how such investment decisions might have played out subsequently.
Adapting RSI for Different Markets
The versatility of the Relative Strength Index (RSI) extends far beyond the realm of stock markets, making it an invaluable tool for various financial markets. Its application is particularly effective in markets where price movement data is readily available, allowing for the calculation and interpretation of RSI across diverse asset classes. Here are some examples of how RSI can be adapted for different markets:
- Cryptocurrencies (e.g., Bitcoin, Ethereum): In the highly volatile crypto market, RSI can be a key indicator for spotting potential trend reversals or extreme market conditions. For instance, an RSI reading above 70 might indicate that Bitcoin is overbought, potentially signalling a future price correction.
- Forex (Foreign Exchange Market): Currency traders often use RSI to gauge the momentum of different currency pairs. For example, an RSI below 30 for a USD/EUR pair might suggest that the USD is oversold relative to the EUR, potentially signalling a buying opportunity.
- Commodities (e.g., Wheat, Oil, Gold): Commodities traders can utilize RSI to assess the strength of a price trend in commodities. For example, if the RSI for gold remains consistently above 70, it might indicate sustained buying pressure, hinting at a strong uptrend.
Indices (e.g., S&P 500, NASDAQ):
Each market’s unique characteristics, such as volatility, liquidity, and market cycles, can affect how RSI is interpreted. Therefore, while the basic principles of RSI apply across markets, it’s crucial for traders and investors to adapt their RSI analysis to the specific dynamics of the market they are dealing with.
The adaptability of RSI across different asset classes and markets makes it a universally valuable tool in financial analysis. Whether you’re a crypto enthusiast, a Forex trader, or a commodities investor, mastering RSI can enhance your ability to make informed decisions based on market momentum and trends.
Further Enhancements to RSI Calculations in Excel
While the Relative Strength Index (RSI) is a powerful tool in your trading arsenal, especially when utilized within Excel, it’s important to consider additional aspects to enhance its effectiveness. Here are some key points to consider when integrating RSI into your trading strategies and combining it with other indicators:
Devising a Comprehensive Trading Strategy
- RSI should not be used in isolation. It’s most effective when part of a broader trading strategy. Consider factors such as your investment goals, risk tolerance, and the time frame of your trades.
- Implement rules for entry and exit points based on RSI readings. For example, consider buying when the RSI is below 30 and selling when it exceeds 70, but only if these signals align with your overall strategy.
Combining RSI with Moving Averages
- Pairing RSI with a moving average indicator can provide a clearer picture of the market trend. For instance, you could use a 50-day or 200-day moving average to determine the overall trend and then use RSI to time your entry and exit points within that trend.
Utilizing RSI with Bollinger Bands
- Bollinger Bands are a volatility indicator that can be combined with RSI to identify overbought or oversold conditions within the context of the market’s volatility. When the price touches the upper Bollinger Band and the RSI is above 70, it may signal an overbought condition, and vice versa for the lower band and an RSI below 30.
RSI Divergence for Reversal Signals
- Pay attention to divergences between RSI and price movements. For example, if a stock’s price hits a new high, but the RSI does not, it may indicate a weakening trend and potential reversal.
Back-testing Your Strategy in Excel
- Utilize Excel’s capabilities to back-test your RSI-based strategy. This involves testing your strategy against historical data to see how it would have performed, helping you refine it before applying it to live markets.
- Market conditions change, and so should your strategy. Regularly review and update your approach based on current market dynamics and your own trading performance.
Remember, while RSI is a useful indicator, it’s not fool proof. Combining it with other tools and a well-thought-out trading plan can greatly enhance your decision-making process. Always ensure that your trading strategy aligns with your financial goals and risk tolerance, and never rely solely on one indicator for all decisions.
Summary
Throughout this post, we’ve explored the ins and outs of the Relative Strength Index (RSI) – a versatile and powerful tool in the world of trading and investing. By now, you should have a solid understanding of what RSI is, why it’s useful in making informed trading decisions, and most importantly, how to calculate and chart RSI trends in Excel. We’ve also delved into adapting RSI for different markets and the importance of integrating it within a broader trading strategy.
The journey through RSI in Excel underscores the importance of not just understanding technical indicators, but also the necessity of applying them in a practical, hands-on manner. By leveraging Excel’s capabilities, we’ve unlocked a practical approach to track and analyse market momentum, enabling you to make more data-driven decisions.
However, it’s crucial to remember that RSI, like any other technical tool, is not a standalone solution. It’s most effective when combined with other indicators and within the context of a comprehensive trading strategy. The real power lies in your ability to interpret and integrate these insights into your unique trading or investment approach.
As you move forward, continue to experiment with RSI, test your strategies, and stay adaptable to market changes. Always keep in mind the importance of continuous learning and staying updated with market trends and analysis techniques.
Keep Excelling,

After diving deep into calculating RSI in Excel, are you ready for another powerful tool to enhance your financial toolkit? I’m excited to introduce you to our Free Excel Dollar Cost Averaging Calculator – a must-have for anyone looking to optimize their investment strategy.
Whether you’re a seasoned investor or just starting out, dollar-cost averaging is a time-tested technique to reduce market risk. Our user-friendly calculator simplifies this process, helping you to plan and execute your investment strategy with precision.