
Have you ever wished for a simpler way to apply the insights of the Guppy Multiple Moving Average (GMMA) in your trading strategies? The Excel GMMA Calculator is the solution you’ve been searching for.
Designed with both novice and experienced traders in mind, this free tool demystifies the process of leveraging the GMMA, allowing for a deeper understanding of market trends without the need for complex software or tedious manual calculations.
I understand the frustration of missing out on valuable trading opportunities because the available tools are too complicated or expensive. That’s why the Excel GMMA Calculator was created – to make advanced trading insights accessible to everyone.
With just a few clicks, you can calculate the GMMA and empower yourself to make informed trading decisions with ease. Let’s dive into how this tool can transform your trading strategy and save you time in the process.
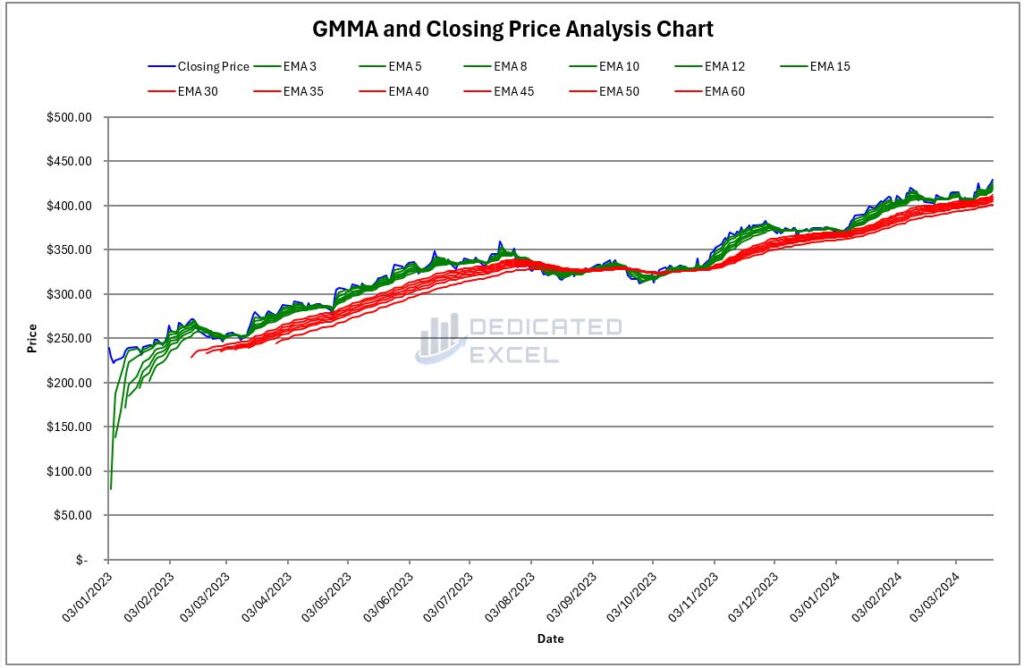
Table of Contents
- What is the Guppy Multiple Moving Average?
- Why Calculate the Guppy Multiple Moving Average?
- How does the Excel GMMA Calculator help you?
- How to Use the Free Excel GMMA Calculator
- What Do the Excel GMMA Calculator Outputs Show?
- Interpreting the GMMA Results
- Troubleshooting Common Issues
- Free Download of the Excel GMMA Calculator
- Summary
What is the Guppy Multiple Moving Average?
The Guppy Multiple Moving Average (GMMA) is an indicator used in technical analysis to identify changing trends, potential breakouts, and consolidation periods in the stock market.
It comprises two sets of exponential moving averages (EMAs): one short-term and one long-term.
The short-term EMAs highlight the trading sentiment and price momentum, while the long-term EMAs reflect the consensus of value among investors over a longer period.
When these two groups converge or diverge, they signal potential trading opportunities, making the GMMA a favorite tool among traders seeking to gauge market sentiment and direction.
Why Calculate the Guppy Multiple Moving Average?
Calculating the GMMA can significantly enhance your trading strategy by providing a comprehensive view of market trends and potential shifts in momentum.
It allows traders to visually assess the strength of a trend and pinpoint moments of consolidation, which can be crucial for making informed decisions about entry and exit points.
The GMMA’s ability to combine multiple moving averages gives a nuanced picture of market movements, helping traders to distinguish between short-term fluctuations and more significant, longer-term trends.
Understanding these dynamics can lead to more strategic trading moves and improved overall performance in the market.
How does the Excel GMMA Calculator help you?
The Excel GMMA Calculator is not just a tool; it’s your gateway to harnessing the power of the Guppy Multiple Moving Average with unprecedented ease and accuracy.
Here’s how it facilitates your trading analysis:
- Automated Calculations: The calculator automates the entire process of calculating the GMMA, saving you time and reducing the likelihood of manual errors. This ensures that you can focus more on analysis and less on the mechanics of calculation.
- Visual Trend Analysis: It provides immediate visual representation of both short-term and long-term EMAs, making it easier to identify market trends and potential trading opportunities at a glance.
- User-Friendly Design: Designed with the user in mind, the Excel GMMA Calculator caters to traders of all levels of expertise, from beginners to seasoned professionals. Its intuitive interface allows for easy input of data and interpretation of results.
- Scenario Testing: The tool enables traders to experiment with different data sets, allowing for scenario testing and a deeper understanding of how various market conditions affect the GMMA.
- Immediate Insights: With the Excel GMMA Calculator, you gain immediate insights into market dynamics, helping you to make more informed and timely trading decisions.
By incorporating the Excel GMMA Calculator into your trading strategy, you’re equipping yourself with a powerful tool that simplifies complex analyses.
It transforms raw data into actionable insights, enabling you to navigate the markets with greater confidence and precision.
How to Use the Free Excel GMMA Calculator
Unblock File and Enable Macros
After downloading the file you may have to unblock the file as it contains macros.
To do so navigate to your Downloaded copy of the Excel GMMA Calculator, right-click on the file and select ‘Properties‘.
At the bottom of the ‘Properties‘ box you’ll find the ‘Security‘ section, ensure the ‘Unblock‘ box is checked and click ‘Apply‘ then ‘OK‘.

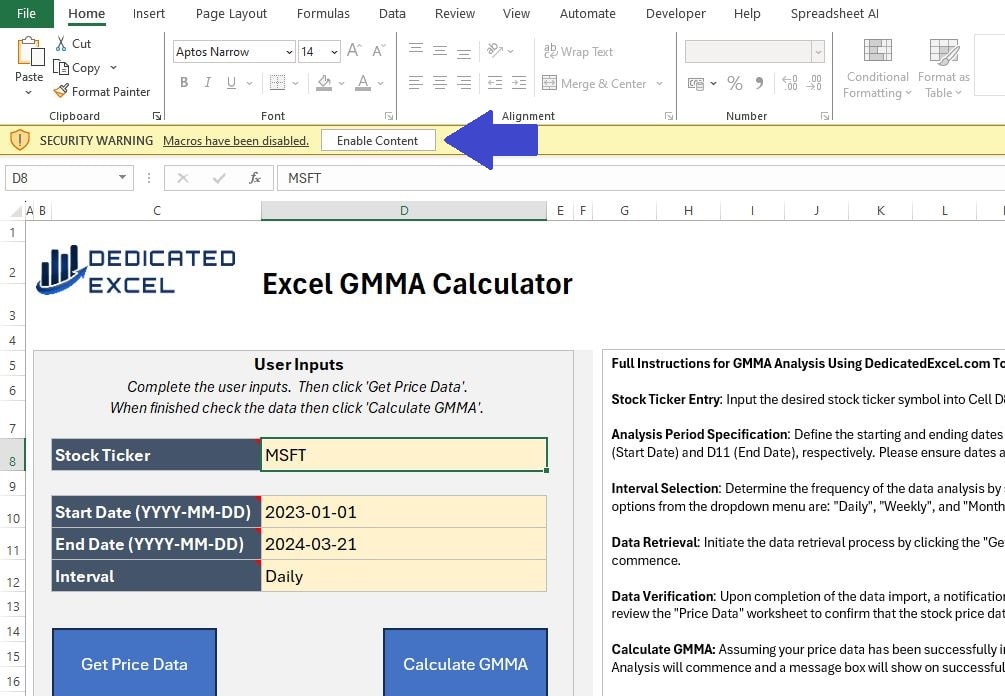
When you open the Excel GMMA Calculator, a prompt will appear asking you to ‘Enable Content’.
By clicking this, you activate the macros responsible for importing stock prices and executing the GMMA calculations, ensuring the tool functions as intended.
Complete User Inputs
The next step is to complete the User Input section.
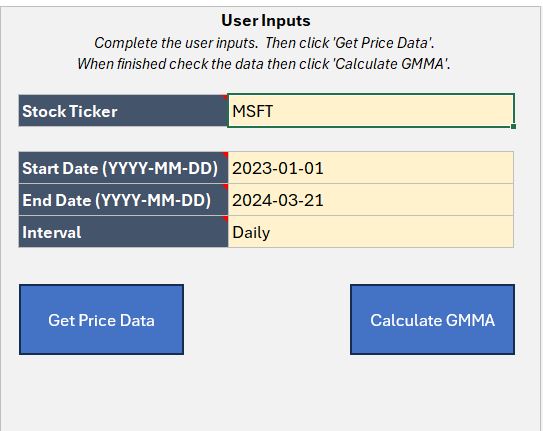
There are only 4 sections to complete, all designed so you can tailor your GMMA analysis to suit your needs:
- Stock Ticker: Input the ticker symbol for the stock, or cryptocurrency, to analyse. For example AAPL is the ticker symbol for Apple, MSFT is the ticker for Microsoft or ETH-USD is the Ethereum USD price. If you don’t know the ticker symbol you can look it up on financial sites like yahoo finance.
- Start Date: Enter the Start Date for the period you wish to analyse. The Date must be entered in YYYY-MM-DD format, including the dashes for seperating.
- End Date: Enter the End Date for the period you wish to analyse. The Date must be entered in YYYY-MM-DD format, including the dashes for seperating. Note that Prices are generally updated on weekdays (with the exception of Cryptocurrencies) and to get a closing price the stockmarket must have finished trading for the day.
- Interval: Select an Interval for the Prices using the dropdown. You can choose from Daily, Weekly or Monthly Prices.
Get Price Data
Once you’ve entered your details in the User Inputs section, the initial step in the analysis involves clicking the ‘Get Price Data’ button. This action imports the Price data according to your specified inputs.
It’s crucial to verify that the ‘Price Data’ worksheet is filled with the relevant data before proceeding. This check confirms that Excel has successfully imported the necessary information for your analysis.
Be aware that selecting the ‘Get Price Data’ button will remove any pre-existing worksheets or charts to make way for a new analysis.
You don’t need to manually delete worksheets; simply input your new data and begin anew.
Calculate GMMA
The final step is to click on the ‘Calculate GMMA‘ button.
This will perform the GMMA analysis for your imported prices and produce five chart outputs.
What Do the Excel GMMA Calculator Outputs Show?
There are five outputs to the Excel GMMA Calculator:
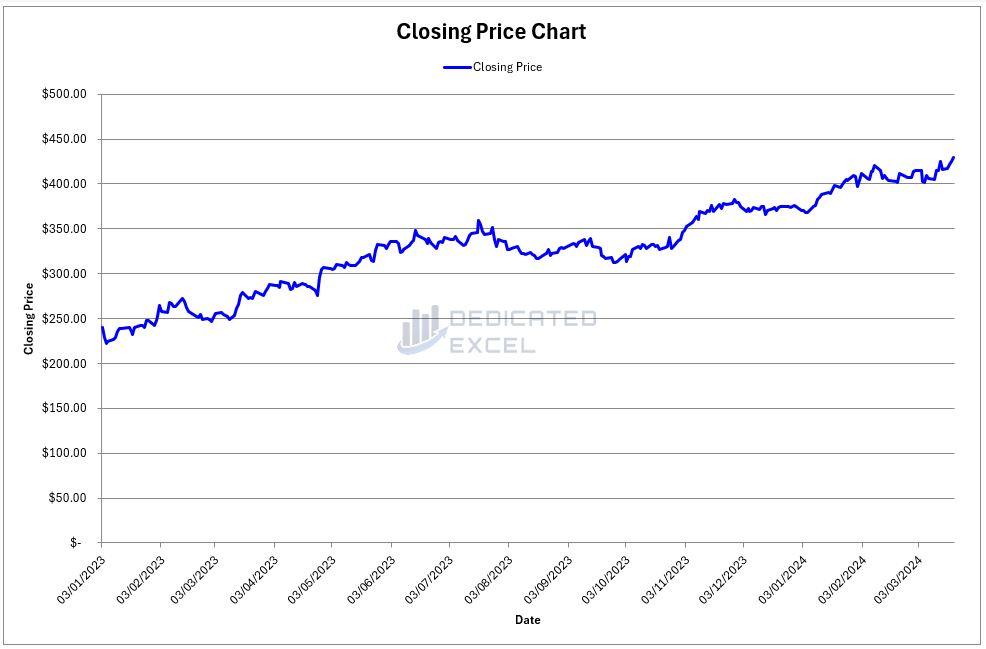
Price Line Chart
This chart simply shows the stock’s closing prices over your chosen time. It connects the end-of-day prices with a line, so you can easily see if the stock went up or down.
It’s a straightforward way to look at the stock’s movement, helping you understand its trend at a glance.
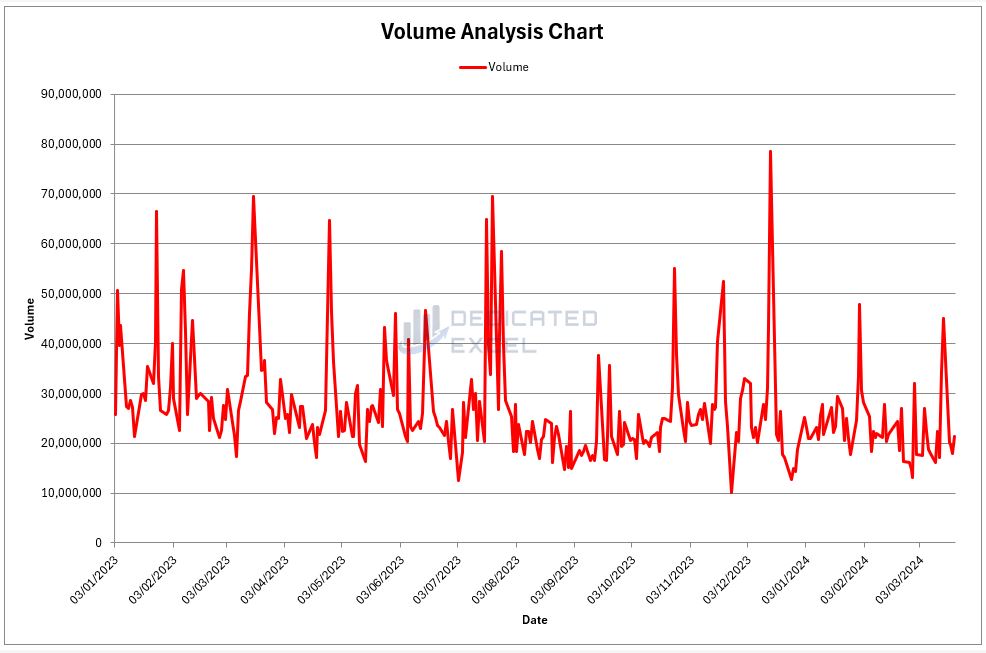
Volume Line Chart
This chart shows how many shares were traded each day in your chosen time frame. It helps you see how active the trading was.
Days with lots of shares traded show a lot of interest and can mean big changes in price.
Days with few shares traded show less interest, which might mean the stock is settling down.
Seeing how trading volume changes can help you get a feel for the market’s energy.
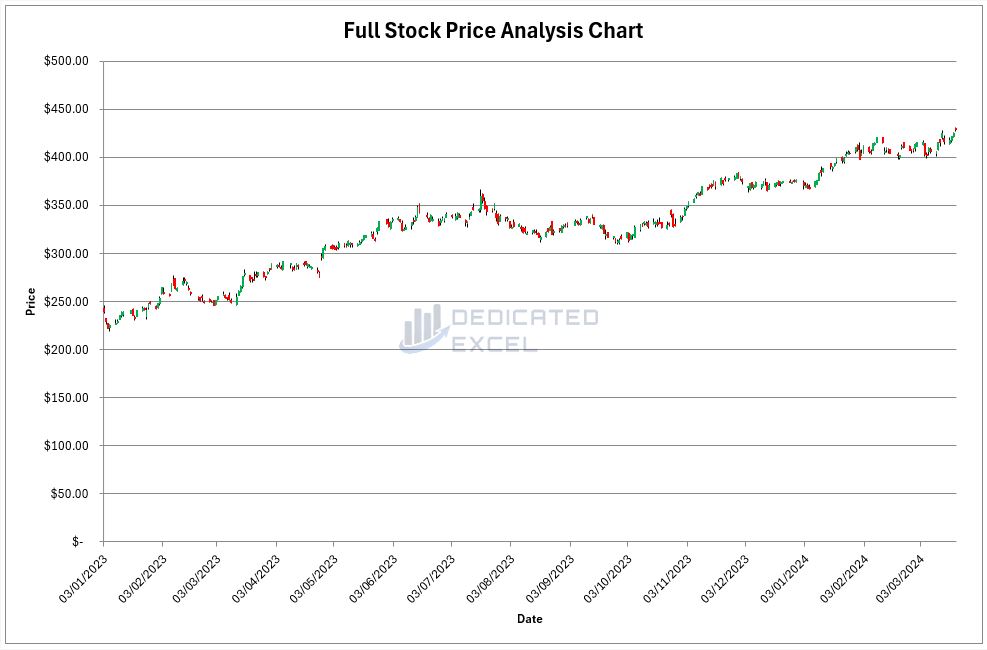
Full Price Chart
This chart gives you a full picture of what happened with the stock’s price. It shows the opening, highest, lowest, and closing prices for each day.
Days when the price ended higher than it started are shown in green, and days when it ended lower are in red.
This makes it easy to see if prices are generally going up or down and how much they change each day.
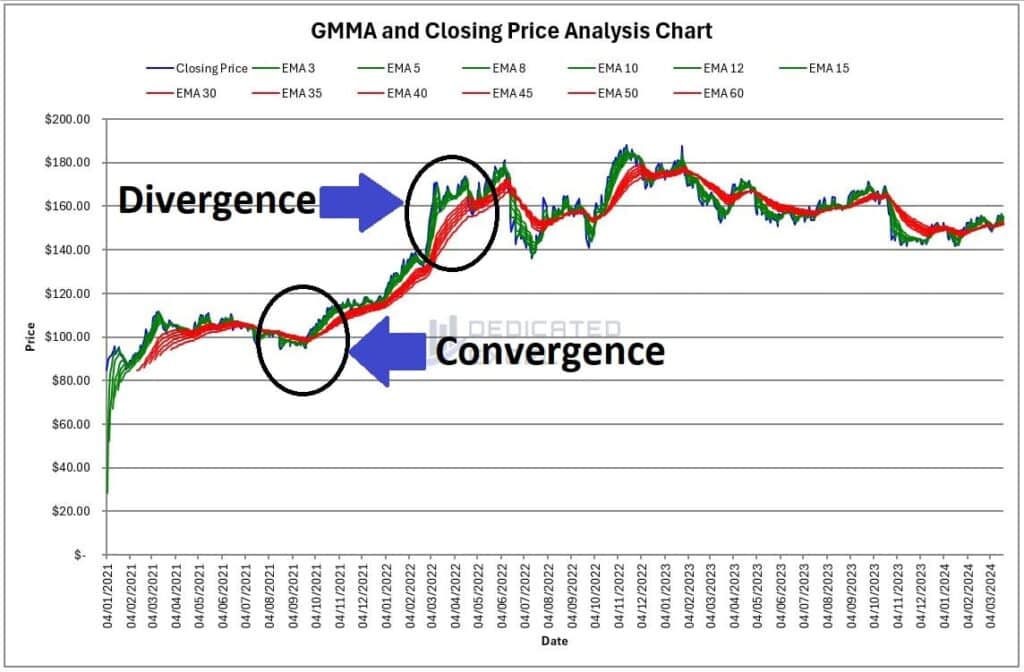
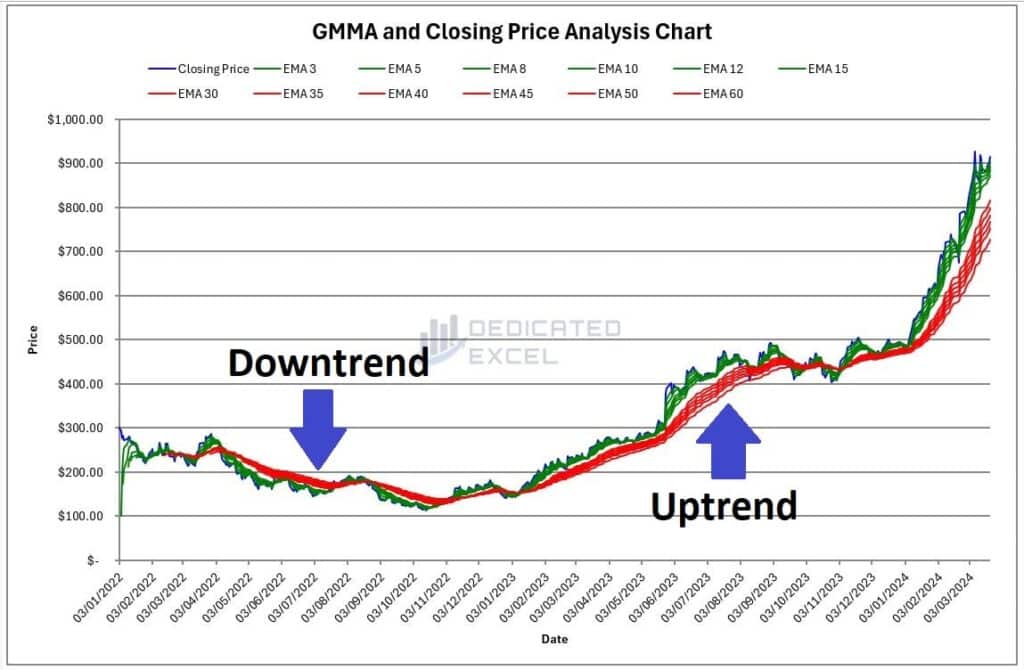
GMMA Chart
The GMMA Chart is designed to give you a detailed look at market trends through the lens of the Guppy Multiple Moving Average.
It plots the stock’s closing price as a blue line, making it easy to track daily closing values over time.
The short-term Exponential Moving Averages (EMAs), which are 3, 5, 8, 10, 12, and 15 days, are shown as green lines.
These highlight quick changes and traders’ immediate reactions to news and market events.
The long-term EMAs, set at 30, 35, 40, 45, 50, and 60 days, appear in red. They provide a clearer view of the underlying, more stable market sentiment and trends over a longer period.
This color-coded system on the GMMA Chart helps you quickly identify the interaction between short-term trading activity and long-term market movements.
By observing how these green and red lines converge and diverge, you can gauge the strength of market trends, identify potential reversal points, and make more informed decisions.
The date along the x-axis ensures you can easily correlate market events with movements in these averages, offering valuable insights into how current trends compare to historical performance.
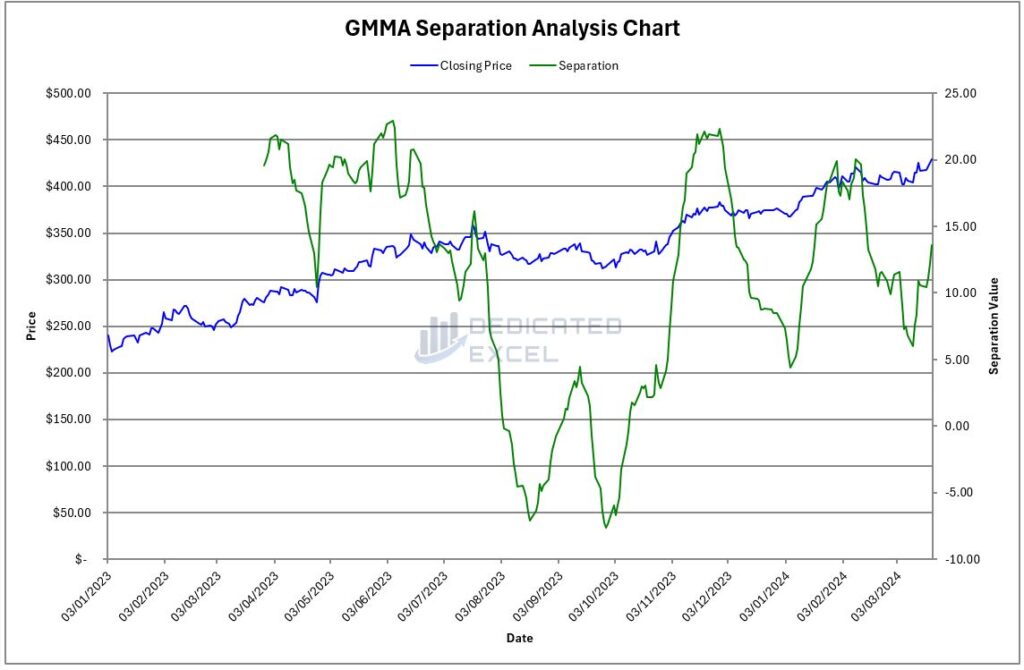
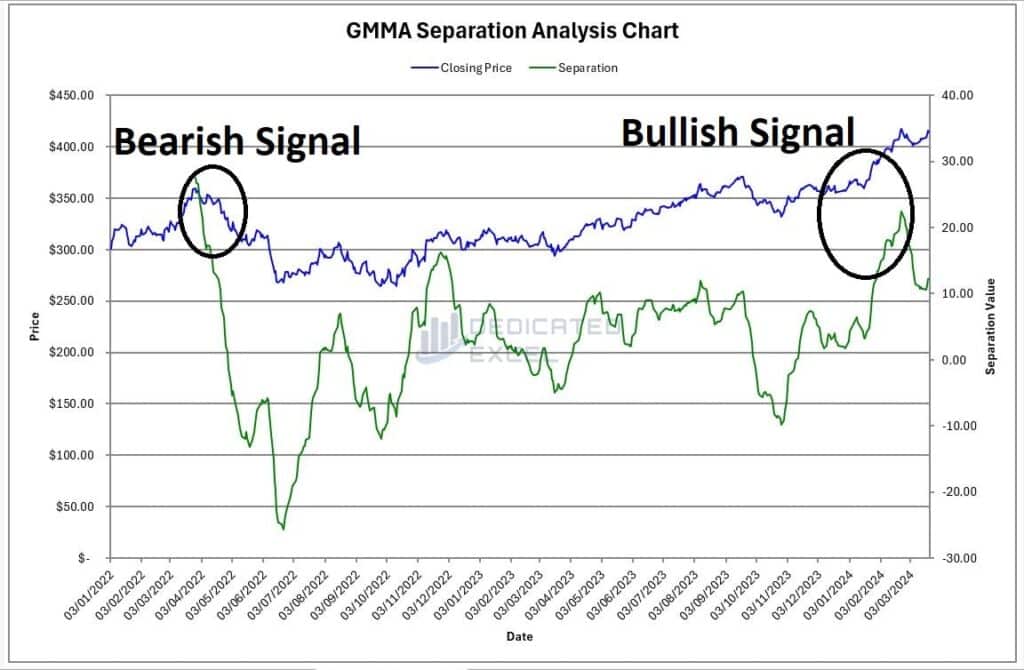
GMMA Separation Chart
The GMMA Separation Chart offers a unique perspective on market dynamics by focusing on the difference between short-term and long-term Exponential Moving Averages (EMAs) of a stock.
It features the closing price as a blue line, which provides a straightforward visualization of the stock’s daily closing values.
Along the x-axis, dates are plotted to help you track the stock’s performance over time.
The heart of this chart lies in its depiction of GMMA Separation, represented as a green line plotted against a secondary Y-axis.
This separation line measures the gap between the average of the short-term EMAs (3, 5, 8, 10, 12, and 15 days) and the average of the long-term EMAs (30, 35, 40, 45, 50, and 60 days).
Essentially, it quantifies the divergence or convergence between traders’ short-term views and the long-term market consensus.
This chart is invaluable for identifying shifts in market sentiment. A widening gap suggests increasing momentum, with the direction indicating whether the movement is bullish or bearish.
Conversely, a narrowing gap could signal a potential reversal or consolidation in the market.
By providing a clear visual of these trends alongside the actual closing prices, the GMMA Separation Chart helps traders pinpoint optimal entry and exit points, enhancing decision-making with a deeper analysis of market trends.
Interpreting the GMMA Results
Understanding the results from the Guppy Multiple Moving Average (GMMA) can significantly enhance your trading strategy by offering insights into market trends, sentiment, and potential shifts in momentum.
Here’s how to interpret the GMMA results effectively to make informed trading decisions:
Convergence and Divergence
Look for points where the short-term (green) and long-term (red) EMAs converge or diverge.
Convergence can indicate a potential market consolidation or reversal, while divergence often signals the strengthening of a current trend.
Direction of EMAs
The overall direction of the EMAs (upwards or downwards) can help identify the trend’s direction.
An upward trend in short-term EMAs (green lines) ahead of long-term EMAs (red lines) may suggest bullish sentiment, whereas the opposite can indicate bearish sentiment.
GMMA Separation
A widening separation indicates increasing momentum in the direction of the trend, while a narrowing separation could suggest a slowing trend or potential reversal.
Compare the GMMA Separation (green line) with the closing price (blue line).
An increase in separation alongside an upward price movement confirms bullish momentum, and vice versa for bearish trends.
Making Trading Decisions
- Identify Entry and Exit Points: Use the GMMA charts to pinpoint optimal entry and exit points.
Enter trades when you observe a clear trend confirmed by the GMMA Separation chart, and consider exiting when the separation begins to narrow, indicating a potential change in trend. - Assess Market Sentiment: The GMMA offers a visual representation of both short-term trader activity and long-term investor sentiment. Use this to gauge the market’s overall mood and align your trades accordingly.
Troubleshooting Common Issues
The Excel GMMA Calculator comes equipped with sophisticated error-handling capabilities, offering clear messages to assist you in troubleshooting prevalent issues.
To navigate these challenges, consider the following advice:
- Enabling Macros: Immediately upon launching the Excel GMMA Calculator, ensure that Macros are activated. Macros are essential for the tool’s operation, as they facilitate the import of stock price data and the execution of the GMMA analysis. Without Macros, the calculator cannot perform its intended functions.
- Input Field Accuracy: Double-check that all required input fields are filled accurately, with special attention to the proper formats, particularly for dates. Incorrect or incomplete inputs can disrupt the analysis process.
- Ticker Validation: Confirm the accuracy of the stock ticker symbol. If no data populates the ‘GMMA Data’ worksheet after you engage the ‘Get GMMA Data’ button, the issue often stems from an erroneous or incorrectly formatted ticker symbol.
- StockHistory Function Issues: Occasionally, Excel’s StockHistory function, which is integral to the calculator’s data import process, may not operate correctly due to external factors such as internet connectivity or service outages.
- Chart Gaps: Gaps might appear in the charts, particularly with British and European stocks, due to non-working days resulting in a #N/A error. Although the calculator’s calculations take these gaps into account, they may still manifest as minor discontinuities in the visual data presentation.
If after addressing the above points you encounter ongoing issues, try these additional steps:
- System Restart: A simple but often effective solution is to restart your computer. This action can fix many minor issues affecting Excel’s performance.
- Reopen the Calculator: Close and then reopen the Excel GMMA Calculator, ensuring your internet connection is stable, to refresh the tool’s connection to external data sources.
Following these steps should help you effectively troubleshoot and resolve common issues with the Excel GMMA Calculator. Keeping Excel up to date and ensuring a reliable internet connection can also improve the tool’s functionality and reliability.
Free Download of the Excel GMMA Calculator
Download Free Excel GMMA CalculatorSummary
In summary, the Excel GMMA Calculator is an invaluable tool for traders looking to enhance their market analysis with the Guppy Multiple Moving Average.
While the GMMA offers a nuanced view of market trends and sentiment, it’s important to remember that like any analytical tool, it should not be used in isolation. For a more rounded approach to market analysis, the GMMA can be effectively paired with other indicators.
One such complementary tool is the Relative Strength Index (RSI), which measures the speed and change of price movements to identify overbought or oversold conditions. Combining the insights from the GMMA with the RSI can provide a more comprehensive understanding of market dynamics.
Fortunately, for those looking to integrate this, or other approaches into their analysis, I have created a range of Free Excel Tools for this purpose, why not download them all!
- Excel ATR Calculator (Average True Range)
- Excel MACD Calculator (Moving Average Convergence Divergence)
- Excel RSI Calculator (Relative Strength Index)
Remember, successful trading strategies often rely on a combination of tools and indicators to gauge market conditions accurately. By leveraging the Excel GMMA Calculator alongside other analytical resources like the RSI, traders can significantly enhance their market analysis and decision-making process.
Keep Excelling,

Disclaimer: Please note this is not a tool aimed at providing financial advice, it merely showcases features of the Microsoft Excel software package.
The free Excel GMMA calculator relies on external data sources for prices and performs various calculations, none of which have been independently validated.
Please consult a qualified financial advisor before making any investments. This file may not be published on other websites or file sharing services without written consent from the owner.
Ready to take your investment strategy to the next level? Whether you’re navigating the volatile waters of the crypto market or the more traditional realms of stocks, our Excel Dollar Cost Averaging Calculator is the tool you need.
Dive into a smarter way to invest and watch your portfolio grow with confidence. Don’t let market fluctuations derail your investment goals—discover how dollar cost averaging can work for you today!