
Are you after a straightforward method to incorporate the Average True Range (ATR) into your trading analysis? The Excel ATR Calculator is the tool you’ve been waiting for!
This Free Excel ATR Calculator is tailored for analysts and traders at every level, simplifying the utilization of the ATR, offering a deeper comprehension of market volatility without the necessity for paid software tools or repetitive manual calculations.
I understand the frustration of overlooking crucial trading opportunities because the tools at hand are overly complex or costly. That’s the rationale behind why I am providing the Excel ATR Calculator – to render advanced trading insights accessible to all.
With just a few clicks, you can compute the ATR, empowering you to make enlightened trading decisions effortlessly. Let’s explore how this tool can revolutionize your trading approach and conserve your time.
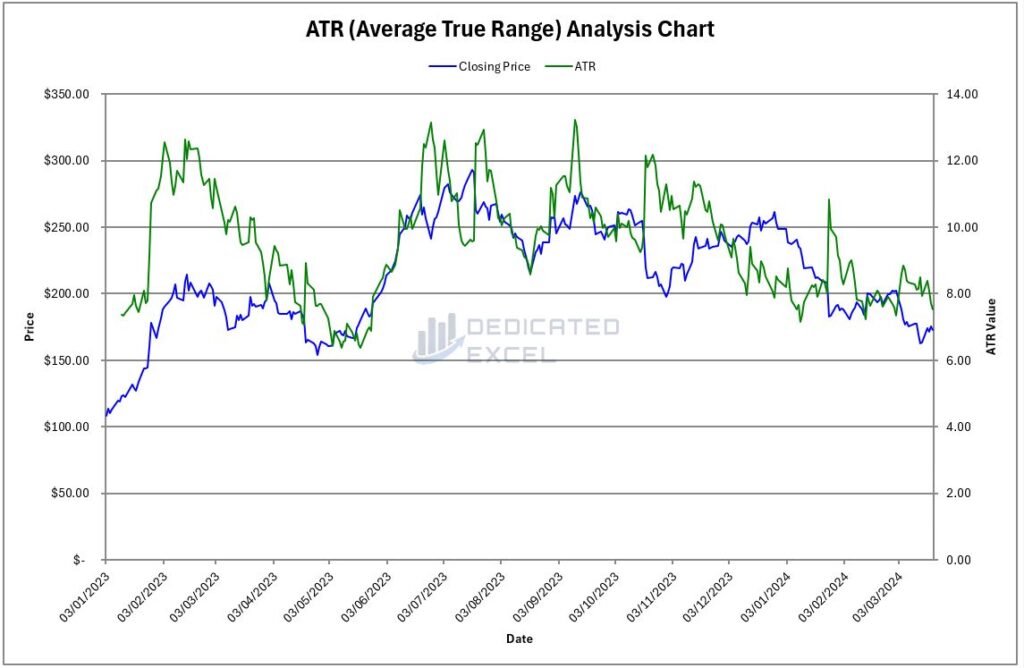
Table of Contents
- What is the Average True Range (ATR)?
- Why Calculate the Average True Range?
- How does the Excel ATR Calculator Assist You?
- How to Use the Free Excel ATR Calculator
- What Do the Excel ATR Calculator Outputs Show?
- Interpreting the ATR Results
- Practical Example Using ATR
- Troubleshooting Common Issues
- Free Download of the Excel ATR Calculator
- Summary
What is the Average True Range (ATR)?
The Average True Range (ATR) is a technical analysis indicator that measures market volatility by decomposing the entire range of an asset for that period. It’s essentially an average of the daily price ranges over a specified period.
For instance, if the ATR over 14 days is 50, it signifies that, on average, the difference between the high and low prices over the past 14 days is 50 points.
This metric is pivotal for traders to understand the volatility of the asset they are trading, offering insights into the potential price movement range.
Why Calculate the Average True Range?
Calculating the ATR can profoundly amplify your trading strategy by granting a detailed perspective on the volatility trends and potential shifts in market momentum.
Consider a trader deciding on a stop-loss order for a stock.
If the stock has an ATR of 5 points, setting a stop-loss order too close to the current price could result in the order being triggered by normal market volatility. Therefore, understanding the ATR can help the trader set a more informed stop-loss order, perhaps 6 to 8 points away, to mitigate the risk of premature order execution.
The versatility of the ATR lies in its ability to adapt to any market or time frame, providing a robust indicator of market sentiment that’s instrumental in navigating through volatile markets.
Understanding the nuances of market volatility can lead to more strategic trading maneuvers and enhanced market performance.
How does the Excel ATR Calculator Assist You?
The Excel ATR Calculator transcends being a mere tool; it is your conduit to mastering the Average True Range with unmatched simplicity and precision.
Here’s how it enhances your trading analysis:
- Automated Calculations: It streamlines the ATR computation, saving precious time and minimizing manual error, allowing you to concentrate more on strategy and less on calculation intricacies.
- Visual Volatility Analysis: Offers instant visual representations of volatility trends, facilitating the identification of market conditions and trading opportunities at a glance.
- User-Oriented Design: The Excel ATR Calculator is crafted for traders of all expertise levels, featuring an intuitive interface for effortless data input and result interpretation.
- Immediate Insights: It provides instant insights into market volatility, aiding in more informed and timely trading decisions. IIncorporating the Excel ATR Calculator into your trading arsenal equips you with a potent tool that demystifies complex analyses.
It transforms raw data into actionable insights, facilitating a more confident and precise navigation of the markets.
How to Use the Free Excel ATR Calculator
Unblock File and Enable Macros
After downloading the file you may have to unblock the file as it contains macros.
To do so navigate to your Downloaded copy of the Excel ATR Calculator, right-click on the file and select ‘Properties‘.
At the bottom of the ‘Properties‘ box you’ll find the ‘Security‘ section, ensure the ‘Unblock‘ box is checked and click ‘Apply‘ then ‘OK‘.

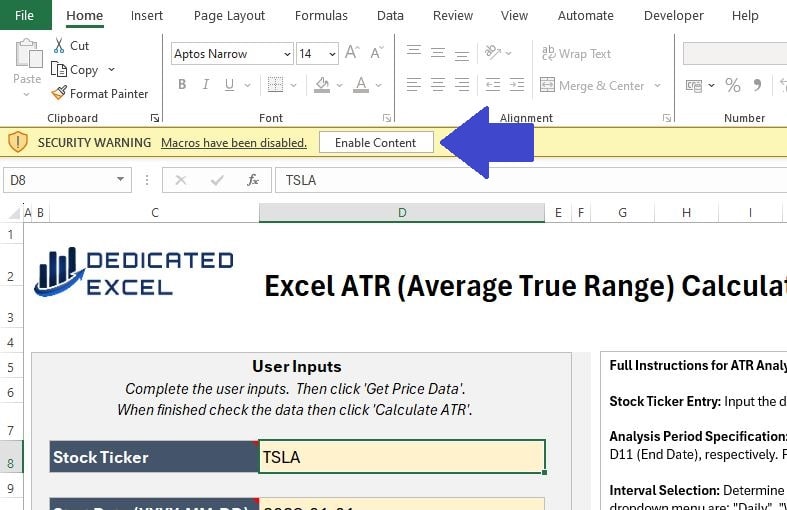
When you open the Excel ATR Calculator, a prompt will appear asking you to ‘Enable Content’.
By clicking this, you activate the macros responsible for importing stock prices and executing the ATR calculations, ensuring the tool functions as intended.
Complete User Inputs
The next step is to complete the User Input section.
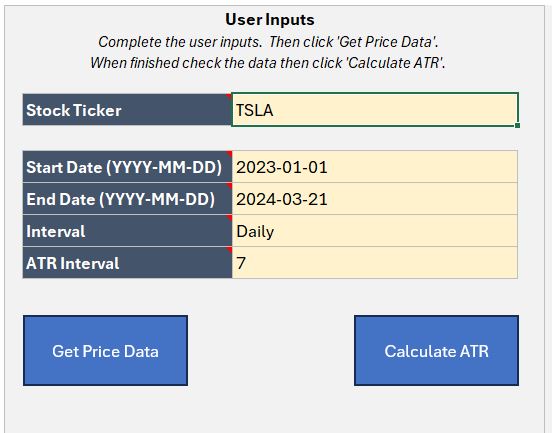
There are five inputs to complete, designed so you can tailor your ATR analysis to suit your needs:
- Stock Ticker: Input the ticker symbol for the stock, or cryptocurrency, to analyse. For example TSLA is the ticker symbol for Tesla, MSFT is the ticker for Microsoft or BTC-EUR is the Bitcoin Euro price. If you don’t know the ticker symbol you can look it up on financial sites like yahoo finance.
- Start Date: Enter the Start Date for the period you wish to analyse. The Date must be entered in YYYY-MM-DD format, including the dashes for seperating.
- End Date: Enter the End Date for the period you wish to analyse. The Date must be entered in YYYY-MM-DD format, including the dashes for seperating. Note that Prices are generally updated on weekdays (with the exception of Cryptocurrencies) and to get a closing price the stockmarket must have finished trading for the day.
- Interval: Select an Interval for the Prices using the dropdown. You can choose from Daily, Weekly or Monthly Prices.
- ATR Interval: Select an Interval for the ATR calculation. The ATR interval is customizable through a drop-down list, offering options of 7, 10, 14, or 20 periods. This allows you to tailor the volatility measurement to fit your specific analysis needs and trading strategy.
Get Price Data
After inputting your information in the User Inputs area, the first step of the analysis is to select the ‘Get Price Data‘ button. This action will bring in the Price data based on the criteria you’ve set.
It’s essential to ensure that the ‘Price Data‘ worksheet is populated with the appropriate data before moving forward. This step is to confirm that Excel has accurately imported the data required for your analysis.
Keep in mind that by clicking the ‘Get Price Data‘ button, Excel will clear any existing worksheets or charts to prepare for the new analysis.
There’s no need to manually remove worksheets; simply enter your updated data and embark on a fresh analysis.
Calculate ATR
The final step is to click on the ‘Calculate ATR‘ button.
This will perform the ATR analysis for your imported prices and produce four chart outputs.
What Do the Excel ATR Calculator Outputs Show?
There are four outputs to the Excel ATR Calculator:
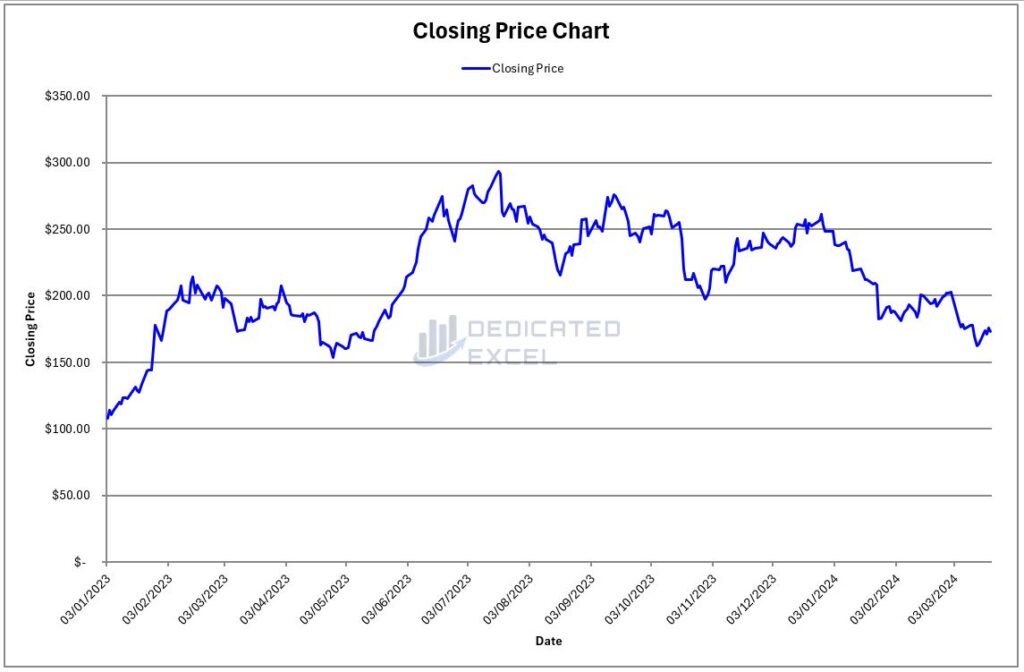
Price Line Chart
The Basic Price Line Chart offers a straightforward view of the closing prices of a stock over your selected date range.
By tracing the end-of-day values with a continuous line, this chart provides an instant visual representation of the stock’s performance.
This simplicity allows you to quickly assess how the price has moved over time, making it a useful chart for evaluating the general trend of the stock.
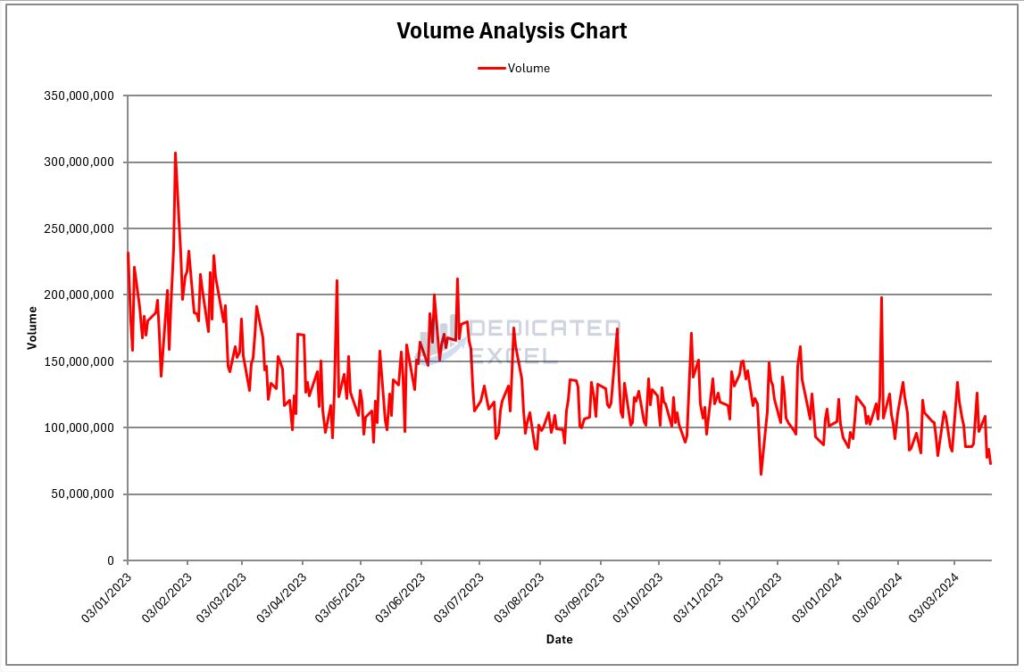
Volume Line Chart
The Volume Line Chart monitors the volume of shares transacted throughout each interval within the timeframe you’ve chosen.
This chart highlights the trading activity and liquidity of the stock.
Periods of high volume may signal robust interest and notable price shifts, whereas periods of low volume could indicate diminished activity and possible consolidation phases.
Grasping the nuances of volume trends is crucial for assessing market sentiment and momentum, offering a more comprehensive perspective.
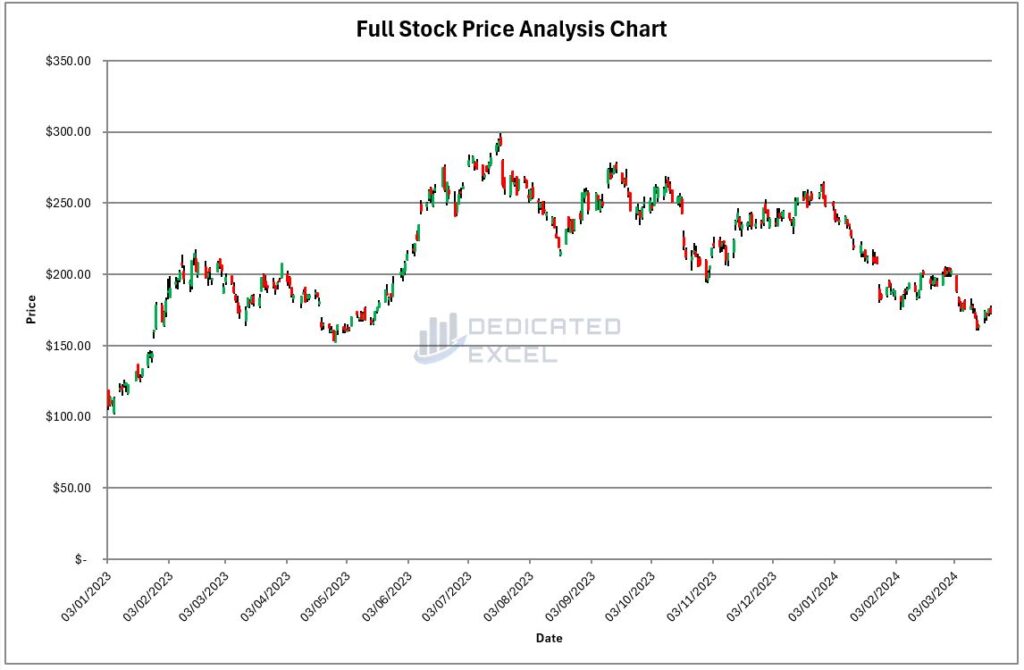
Full Price Chart
The Full Price Chart, also known as an OHLC (Open, High, Low, Close) Chart, provides a comprehensive view of the stock’s price action.
Each bar on the chart represents the range of prices within a single period, with green bars illustrating days when the closing price was higher than the opening (up days), and red bars for days when the closing was lower (down days).
This color-coded visualization helps you quickly find bullish or bearish trends along with the volatility of the stock during each period.
ATR Chart
The ATR chart shows two main things: the stock’s closing price in blue and the Average True Range (ATR) in green, with dates along the bottom (X-axis).
The stock’s closing price is shown on the left side (primary Y-axis), which tells us how much the stock was worth at the end of each day.
The ATR value, which helps us understand how much the stock’s price changes, is on the right side (secondary Y-axis).
This chart helps traders see both the stock’s price over time and how much its price varies, in a simple and clear way.
Interpreting the ATR Results
Understanding the Average True Range (ATR) results from your Excel ATR Calculator can significantly enhance your trading strategies. The ATR provides a measure of market volatility, indicating how much an asset’s price is likely to move on a daily basis.
Here’s how to interpret these results and apply them to your trading strategies:
- Reading the ATR Value: The ATR value represents the average price movement of a stock over a selected period. A higher ATR indicates higher volatility, suggesting that the price of the asset can change significantly in either direction. Conversely, a lower ATR suggests less volatility, with smaller price movements.
- Setting Stop Loss Orders: One of the most practical uses of the ATR is to help set stop loss orders. By understanding the average price movement, traders can set stop losses that are not too tight (to avoid being stopped out prematurely by normal price fluctuations) but not too wide (to avoid excessive losses). A common strategy is to set the stop loss at a multiple of the ATR (e.g., 1.5x ATR) away from the current price.
- Position Sizing: The ATR can also inform your position sizing by helping to manage the risk associated with volatility. By knowing the average movement, you can decide how much of your capital to allocate to a particular trade, aiming to limit potential losses from unexpected market moves.
- Entry and Exit Points: High volatility periods, as indicated by a rising ATR, can signal significant trading opportunities, either for entering or exiting positions. Traders might look for periods where the ATR begins to rise from a low base as a sign that market activity is increasing and a trend may be starting. Conversely, if the ATR is high and begins to decrease, it might suggest that the market is settling and it could be time to secure profits and exit.
- Combining with Other Indicators: While the ATR is a powerful tool for assessing volatility, combining it with other indicators can provide a more nuanced view of the market. For instance, using the ATR in conjunction with trend indicators (like moving averages) or momentum indicators (like the Relative Strength Index, RSI) can help validate potential trading signals.
Practical Example Using ATR
Let’s say you’re analyzing a stock with an ATR of 10. This means that, on average, the stock moves $10 per day. If you’re considering a long position, you might set your stop loss order about $15 (1.5x ATR) below the entry price to give the trade enough room to move without getting stopped out on normal volatility.
Similarly, if the ATR suddenly increases to 15, you should be prepared for larger price swings and adjust your trading strategy accordingly, perhaps by tightening your stop losses or taking profits earlier.
By integrating the ATR into your trading strategy, you leverage volatility to your advantage, enhancing your decision-making process and potentially increasing your trading success. Remember, volatility is not inherently good or bad; it’s how you use the information that counts.
Troubleshooting Common Issues
The Excel ATR Calculator is designed with advanced error-handling features to give you clear guidance on fixing common problems.
Here are some tips for dealing with these issues:
- Activating Macros: When you start the Excel ATR Calculator, make sure to enable Macros. Macros are crucial for the calculator’s functionality, allowing it to bring in stock price data and carry out the ATR calculations. Without Macros, the calculator won’t be able to do its job.
- Check Your Inputs: Make sure all required fields are correctly filled in, paying close attention to the format needed, especially for dates. Wrong or incomplete inputs can mess up the analysis.
- Ticker Symbol Accuracy: Make sure the stock ticker symbol is correct. If the ‘Price Data‘ worksheet doesn’t show any data after you hit the ‘Get Price Data‘ button, it might be because the ticker symbol is wrong or not formatted properly.
- StockHistory Function Problems: Sometimes, the StockHistory function, which the calculator uses to get data, might not work right. This could be because of things like a bad internet connection or service interruptions.
- Gaps in Charts: You might see gaps in the charts, especially with stocks from the UK and Europe, because of days the market was closed, leading to a #N/A error. The calculator accounts for these gaps in its calculations, but they might still show up in the charts.
If you’re still having trouble after trying the above fixes, here are a few more things to try:
- Restart Your System: Restarting your computer can solve many small issues that affect how Excel works.
- Reopen the Calculator: Close the Excel ATR Calculator and then open it again, making sure your internet connection is good, to reset its connection to data sources.
Following these steps should help you sort out most issues with the Excel ATR Calculator. It’s also a good idea to keep Excel updated and ensure your internet connection is reliable to help the calculator work better.
Free Download of the Excel ATR Calculator
Download Free Excel ATR CalculatorSummary
In conclusion, the Excel ATR Calculator stands as a crucial asset for traders aiming to refine their understanding of market volatility through the Average True Range.
While the ATR provides valuable insights into market volatility and potential price movements, it’s vital to recognize that no analytical tool should be used in isolation. For a more comprehensive approach to market analysis, the ATR can be effectively combined with other indicators.
A prime example of a complementary tool is the Relative Strength Index (RSI), which assesses the magnitude of recent price changes to evaluate overbought or undersold conditions. Integrating the data from the ATR with insights from the RSI can offer a more rounded perspective on market conditions.
For those interested in incorporating this methodology, or others, into their analysis, I also offer a range of free Excel tools, why not download them all!
- Excel GMMA Calculator (Guppy Multiple Moving Average)
- Excel MACD Calculator (Moving Average Convergence Divergence)
- Excel RSI Calculator (Relative Strength Index)
Remember, crafting successful trading strategies often involves the synergistic use of multiple tools and indicators to accurately read market signals.
Keep Excelling,

Disclaimer: Please note this is not a tool aimed at providing financial advice, it merely showcases features of the Microsoft Excel software package.
The free Excel ATR calculator relies on external data sources for prices and performs various calculations, none of which have been independently validated. Please consult a qualified financial advisor before making any investments. This file may not be published on other websites or file sharing services without written consent from the owner.
Ready to take your trading analysis to the next level? Don’t miss out on our Free Excel GMMA Calculator! It’s the ultimate tool for decoding market trends and making strategic decisions with confidence. Grab yours now and transform the way you trade!