
Discover the edge you need in the trading arena with our Excel RSI Calculator – your go-to tool for simplifying complex market analysis, now available for free.
Dive into the depths of technical analysis without getting overwhelmed by numbers and jargon.
Our Excel RSI Calculator is expertly designed to provide you with precise Relative Strength Index (RSI) calculations, giving you the insights to make informed decisions.
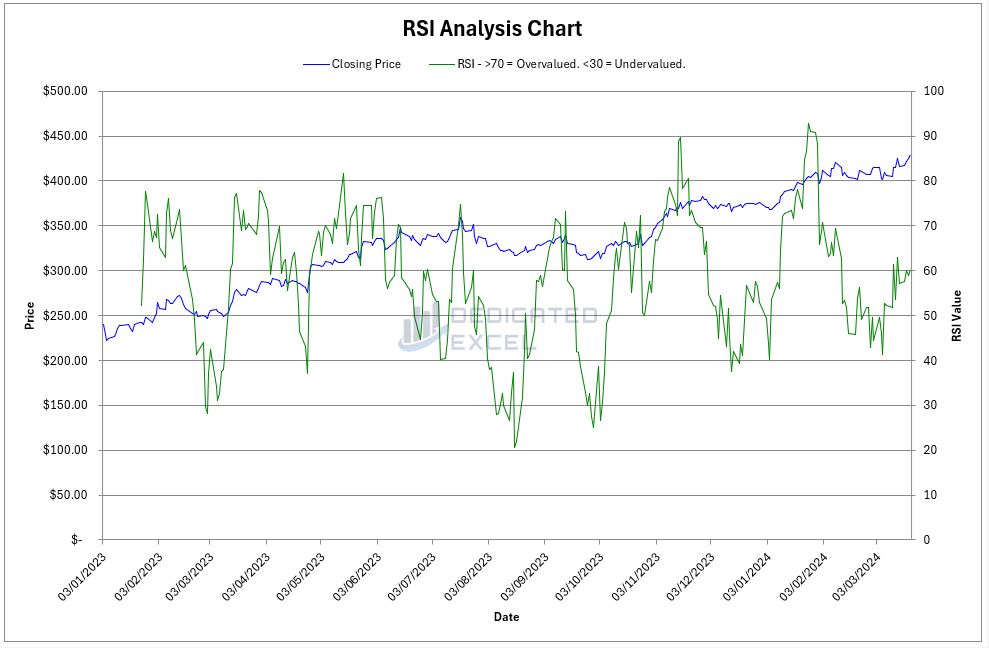
Table of Contents
What is RSI?
The Relative Strength Index (RSI) is a momentum oscillator that measures the speed and change of price movements. Developed by J. Welles Wilder Jr., it oscillates between 0 and 100.
Traditionally, and according to Wilder, RSI is considered overbought when above 70 and oversold when below 30.
RSI aims to indicate the historical strength or weakness of a stock, cryptocurrency or market based on the closing prices of a recent trading period.
This indicator can help traders identify the general trend, potential reversal points, and possible entry or exit points.
Why Calculate RSI in Excel?
Excel is a powerful tool that offers flexibility and accessibility for performing complex calculations like RSI.
By calculating RSI in Excel, you can:
- Manage Large Data Sets: Excel can handle vast amounts of data, allowing traders like yourself to analyze long-term trends and make more informed decisions.
- Customization: You can personalize the RSI calculation parameters to fit your trading strategy and goals.
- Automation and Reusability: Once set up, the Excel RSI calculator can automatically update and recalculate in real-time as new data is entered. It’s a reusable tool that can be applied across various data sets and trading scenarios.
How Does the RSI Calculator Help You?
The RSI Calculator in Excel is a valuable instrument that can streamline your trading process:
- Time-Efficient: It saves you time by automating the calculation process, allowing you to focus on analysis rather than number crunching.
- Accuracy: It reduces the risk of manual errors, ensuring the RSI values are computed precisely every time.
- Decision Support: By providing a clear and objective measure of momentum, it can help you avoid emotional trading decisions.
- Educational: It’s an excellent way for newcomers to learn about RSI and market analysis by interacting with data and seeing the immediate impact of market changes on RSI values.
Whether you’re analyzing stocks, cryptocurrencies or forex, the Excel RSI Calculator can become an integral part of your trading strategy, helping you to act on market opportunities with confidence.
How to Use the Free Excel RSI Calculator
Unblock File and Enable Macros
After downloading the file you may have to unblock the file as it contains macros.
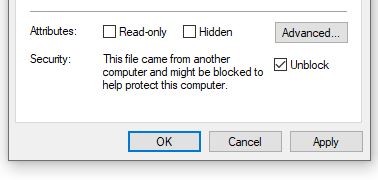
To do so navigate to your Downloaded copy of the Excel RSI Calculator, right-click on the file and select ‘Properties‘.
At the bottom of the ‘Properties‘ box you’ll find the ‘Security‘ section, ensure the ‘Unblock‘ box is checked and click ‘Apply‘ then ‘OK‘.
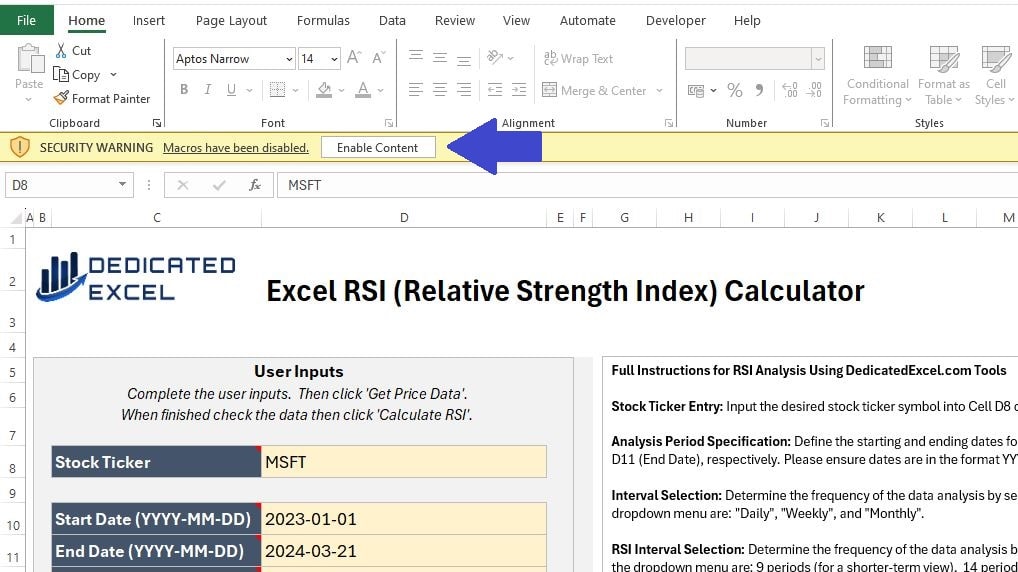
Then upon opening the Excel RSI Calculator you will be asked to ‘Enable Content‘, click this to ensure the macros that import stock prices and generate the RSI calculations are enabled.
Complete User Inputs
The next step is to complete the User Input section.
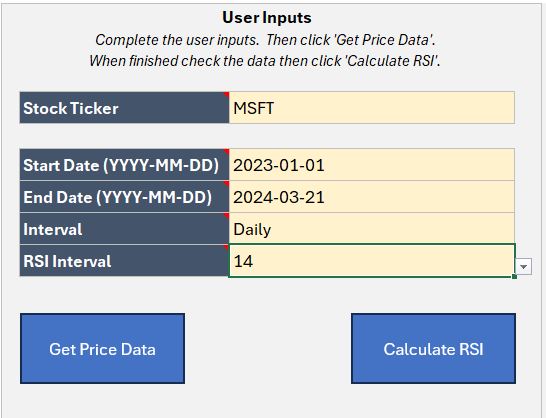
There are 5 sections to complete, designed so you can tailor your RSI analysis to suit your needs:
- Stock Ticker: Input the ticker symbol for the stock, or cryptocurrency, to analyse. For example AAPL is the ticker symbol for Apple, MSFT is the ticker for Microsoft or BTC-USD is the Bitcoin USD price. If you don’t know the ticker symbol you can look it up on financial sites like yahoo finance.
- Start Date: Enter the Start Date for the period you wish to analyse. The Date must be entered in YYYY-MM-DD format, including the dashes for seperating.
- End Date: Enter the End Date for the period you wish to analyse. The Date must be entered in YYYY-MM-DD format, including the dashes for seperating. Note that Prices are generally only updated on weekdays (with the exception of Cryptocurrencies) and to get a closing price the stockmarket must have finished trading for the day.
- Interval: Select an Interval for the Prices using the dropdown. You can choose from Daily, Weekly or Monthly Prices.
- RSI Interval: Select an Interval for the RSI calculation. There are three choices, 9, 14 and 25 periods, for more information see the section later in this post explaining the RSI Intervals.
Get Price Data
When you have completed the User Inputs the first stage in the analysis is to click on the ‘Get Price Data‘ button. This will import the Price Data based on your inputs.
It is important to check that the ‘Price Data‘ worksheet has been populated with Prices before continuing. This ensures that Excel has successfully imported the Prices.
Note that clicking the ‘Get Price Data‘ button clears any existing worksheets or charts produced in order to produce a new analysis. There is no need to delete worksheets, just enter your new inputs and start afresh.
Calculate RSI
The final step is to click on the ‘Calculate RSI‘ button.
This will perform the RSI analysis for your imported prices and produce four chart outputs.
What Do the Excel RSI Calculator Outputs Show?
There are four outputs to this Excel RSI Calculator:
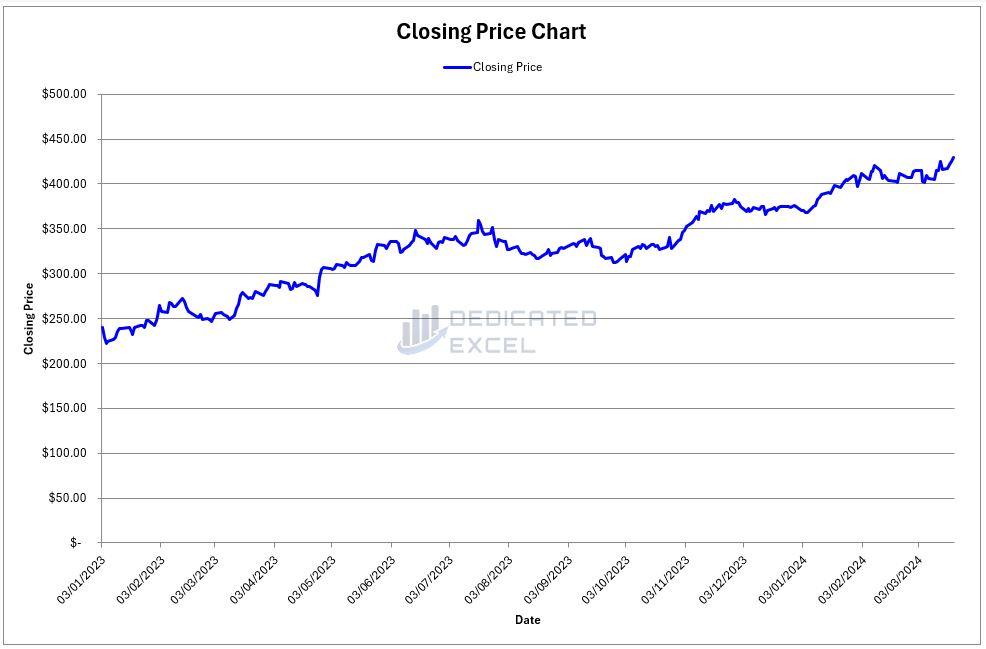
Price Line Chart
The Basic Price Line Chart offers a clear, straightforward view of the closing prices of a stock over your selected date range.
By tracing the end-of-day values with a continuous line, this chart provides an instant visual representation of the stock’s performance.
This simplicity allows you to quickly assess how the price has moved over time, making it a fundamental tool for evaluating the general trend of the stock.
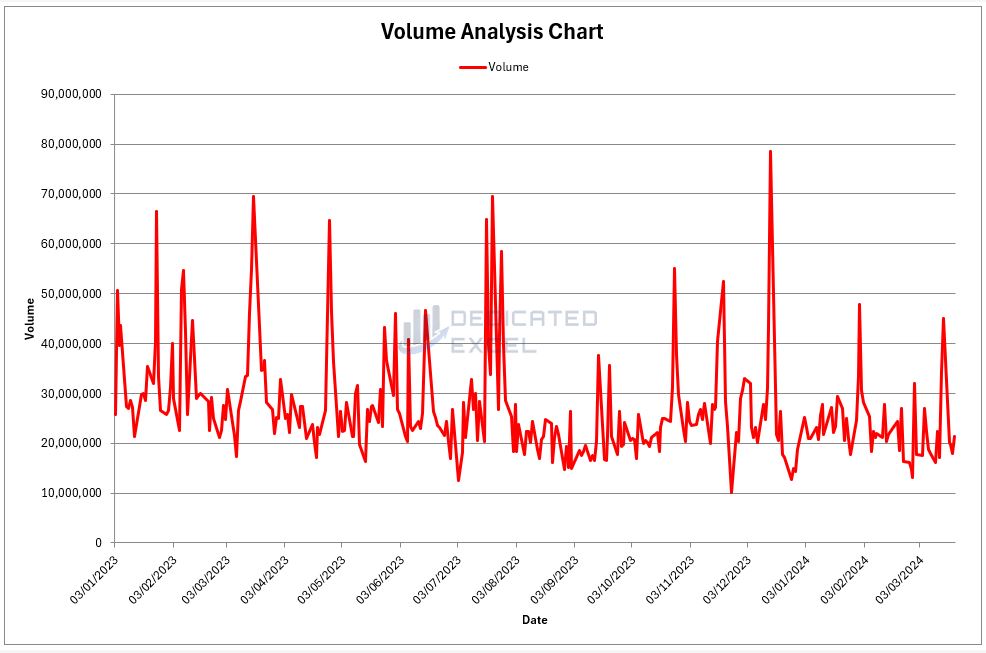
Volume Line Chart
The Volume Line Chart tracks the number of shares traded during each period within your selected date range.
This chart sheds light on the trading activity and liquidity of the stock. High volume periods can indicate strong interest and significant price movements, while low volumes might suggest less activity and potential consolidation.
Understanding volume patterns is essential for gauging market sentiment and momentum.
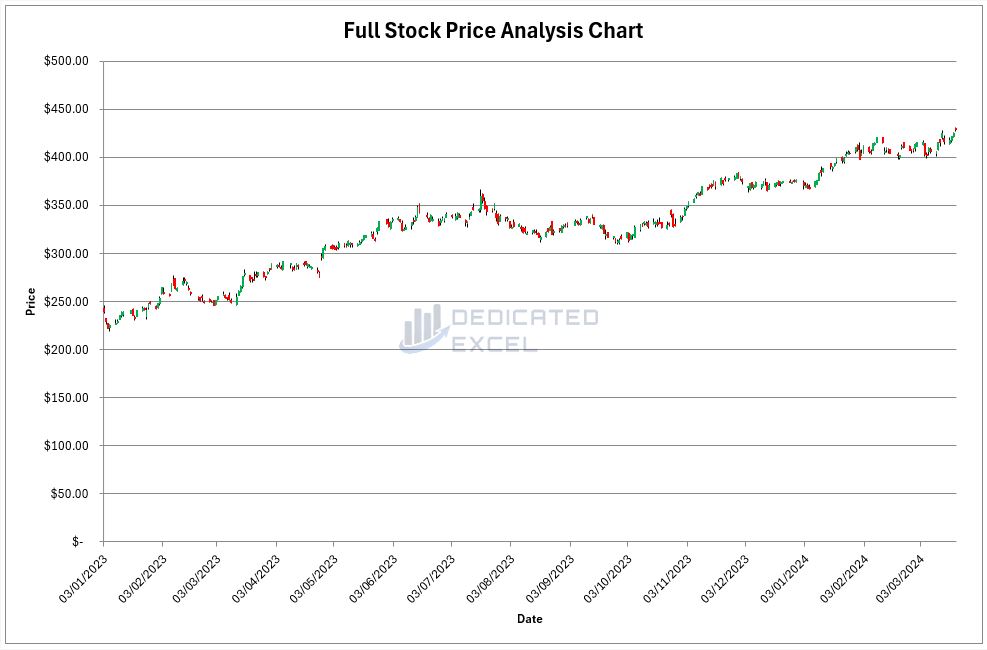
Full Price Chart
The Full Price Chart, often referred to as an OHLC (Open, High, Low, Close) Chart, provides a comprehensive view of the stock’s price action.
Each bar represents the range of prices within a single period, with green bars illustrating days when the closing price was higher than the opening (up days), and red bars for days when the closing was lower (down days).
This color-coded visualization helps you quickly discern bullish or bearish trends and the volatility of the stock during each period.
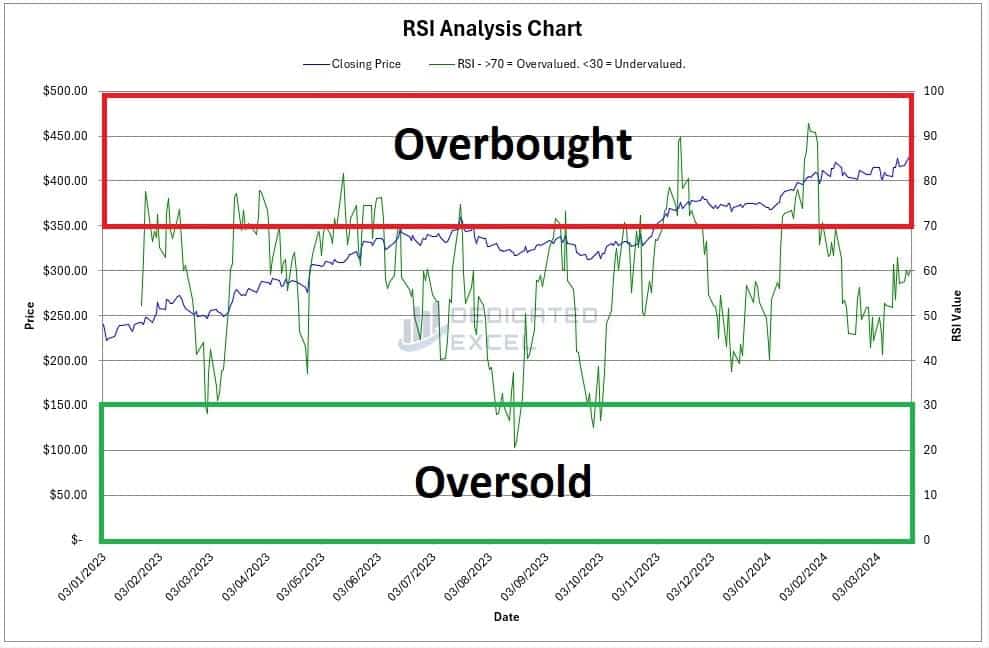
RSI Chart
The RSI Analysis Chart combines a line chart of the closing prices with the Relative Strength Index (RSI) plotted over the same date range.
The closing price is represented by a blue line, while the RSI is shown in green. This dual-chart setup allows you to compare the stock’s price trend directly with its momentum, as indicated by the RSI.
The RSI line provides potential buy or sell signals and insight into whether the stock is considered overbought or oversold within the context of your chosen RSI period.
Explaining the RSI Intervals
The RSI Interval, or period, is a critical component in the calculation of the Relative Strength Index (RSI). It represents the number of trading periods used to calculate the RSI.
For example, if you’re looking at a daily chart, an RSI Interval of 14 would use the last 14 days of trading data in its calculation.
The formula for RSI involves comparing the average gains versus the average losses over this interval to determine the momentum and is typically expressed as:
RSI = 100 – (100 / 1 + (Average Gain / Average Loss ))
The “Average Gain” and “Average Loss” are calculated over the number of periods specified by the RSI Interval.
Why 14 Periods are Standard
The 14-period setting is the standard and the original specification used by J. Welles Wilder, the creator of the RSI.
This interval was chosen based on his observation that it provided a reasonable balance between the sensitivity of the indicator and the stability of its signals.
A 14-period RSI smoothens out the short-term fluctuations and provides a more generalized view of the momentum.
9 Periods for a Shorter-Term View
A 9-period RSI is more sensitive to recent price changes. It can generate more trading signals because it reacts more quickly to small changes in price action. Traders might choose a 9-period RSI when they are interested in shorter-term trading opportunities and are willing to respond to market conditions more rapidly.
25 Periods for a Longer-Term View
On the other hand, a 25-period RSI smoothens out the price movements even more than the 14-period RSI and is less reactive to daily market changes. It tends to provide a clearer picture of the long-term momentum trend. Investors who are interested in a broader view of the market or who are looking for signals to hold positions longer may prefer this setting.
Selecting Different RSI Intervals
Different RSI Intervals may be chosen based on the trader’s or analyst’s objectives:
- Market Conditions: In highly volatile markets, a shorter RSI period might provide too many false signals, so a longer period could be more reliable.
- Trading Style: Day traders or short-term traders might opt for a shorter RSI interval to catch quick movements, whereas long-term investors might prefer a longer interval for trend confirmation.
- Asset Characteristics: Some assets are inherently more volatile than others. Adjusting the RSI interval can help tailor the indicator to the specific characteristics of the asset being traded.
Ultimately, while the 14-period RSI is a good starting point for many traders, the choice of RSI Interval should align with one’s trading strategy, risk tolerance, and the specific attributes of the market being analyzed.
Interpreting the RSI Results
Interpreting the RSI (Relative Strength Index) alongside the closing price of a stock can provide valuable insights into market conditions and potential trading signals.
The RSI oscillates between 0 and 100. Two key levels to watch are 70 and 30.
An RSI above 70 typically indicates that the stock may be overbought, suggesting a potential pullback or reversal.
Conversely, an RSI below 30 suggests the stock may be oversold, potentially indicating an upcoming reversal or bounce.
Trend Confirmation
Look for the RSI to confirm the trend indicated by the price movement.
If the stock price is making new highs (upward trend) and the RSI is also trending upward and not in the overbought territory, it can confirm the bullish trend.
Similarly, during a downtrend, if the price is making new lows and the RSI is trending downward without being in the oversold territory, it confirms bearish momentum.
Divergence
Divergence occurs when the price and RSI move in opposite directions, which can be a powerful signal of a potential trend reversal.
For example, if the price is making higher highs but the RSI is making lower highs, it suggests weakening momentum, and a downward reversal might be imminent.
Conversely, if the price is making lower lows but the RSI is making higher lows, it indicates increasing momentum, suggesting a potential upward reversal.
Swing Rejections
These are specific patterns within the RSI that can signal upcoming reversals.
A swing rejection occurs when the RSI moves into overbought or oversold territory, returns towards more neutral levels, and then moves back into the extreme territory without crossing the previous extreme. This pattern often precedes a reversal in the price direction.
Relative Levels
Beyond the fixed thresholds of 70 and 30, the relative high and low points of the RSI during a specific period can provide cues.
For instance, if during an uptrend, the RSI consistently finds support above 30 before moving higher, this level may serve as a dynamic support indicating the strength of the uptrend.
When interpreting the RSI, it’s crucial to consider it as part of a broader analysis. No indicator should be used in isolation, and the RSI is most effective when combined with other technical analysis tools and fundamentals.
By understanding how to read the RSI in conjunction with the closing price movements, traders can make more informed decisions and refine their trading strategies.
Troubleshooting Issues
The Excel RSI Calculator has in-built error handling, complete with messages to help you troubleshoot common issues.
If you are having an issues with the Excel RSI Calculator some checks to make are:
- Make sure Macros have been enabled when opening the file. The RSI Calculator requires the use of Excel Macros in order to import the stock price data and then perform the RSI Analysis.
- Double-Check that you have completed all the Input fields and have used the correct formats, especially for Dates.
- Ensure the Ticker is correct. After you click on the ‘Get Price Button’ data if no data has been imported to the ‘Price Data’ worksheet then it’s likely the Ticker is incorrect or in the incorrect format.
Lastly there are occassions where Excel’s StockHistory import can fail.
If you are sure all the details have been completed correctly I suggest closing your system down, re-booting, and trying again. It’s amazing how many times something simple like this can fix the issue.
Free Download of the Excel RSI Calculator
Download Free Excel RSI CalculatorSummary
In summary this Excel RSI Calculator is great way to analyse stocks, cryptocurrency or forex for Overbought or Oversold conditions. This knowledge can help assist you with your trading strategies and decisions.
Remember RSI is just one of many market indicators. You should never use just a single indicator in your decisions, this is why I created other Free Excel tools just for you.
- Excel GMMA Calculator (Guppy Multiple Moving Average)
- Excel ATR Calculator (Average True Range)
- Excel MACD Calculator (Moving Average Convergence Divergence)
Download them all and get ahead of the game!
Keep Excelling,

Disclaimer: Please note this is not a tool aimed at providing financial advice, it merely showcases features of the Microsoft Excel software package.
The free RSI calculator in Excel relies on external data sources for prices and performs various calculations, none of which have been independently validated.
Please consult a qualified financial advisor before making any investments. This file may not be published on other websites or file sharing services without written consent from the owner.
If you’re the kind who loves to tinker and tailor tools to your unique trading style, dive deeper with us! Explore this detailed post on How to Calculate RSI in Excel, where I unravel the secrets behind developing your own RSI calculator.
Whether you’re a seasoned trader or just starting out, mastering the art of RSI calculation in Excel can empower you to craft a tool that’s perfectly aligned with your trading strategy.
Why wait? Unleash the full potential of your market insights today!