
Are you in search of an efficient way to track and analyze stock market trends using the Moving Average Convergence Divergence (MACD) without the hassle of complex software? The Excel MACD Calculator is precisely what you need!
This Excel MACD Calculator is designed for both budding and seasoned traders, streamlining the process of utilizing the MACD, a crucial indicator for understanding market momentum and trend reversals. It eradicates the need for expensive trading platforms or tedious manual computation.
It’s easy to miss vital trading signals because the available tools are either too intricate or exorbitant. That’s the inspiration behind offering the Excel MACD Calculator – to make sophisticated trading analytics accessible to everyone.
With just a few inputs, you can swiftly calculate the MACD, equipping you to make informed trading decisions with ease. Join me as we delve into how this tool can transform your trading strategy and save precious time.
Table of Contents
- What is the MACD?
- Why Calculate the MACD?
- How Does the MACD Assist You?
- How to Use the Free Excel MACD Calculator
- What Do the Excel MACD Calculator Outputs Show?
- Interpreting the MACD Results
- Practical Example of Using the MACD Chart in Trading
- Troubleshooting Common Issues
- Free Download of the Excel MACD Calculator
- Summary
What is the MACD?
The Moving Average Convergence Divergence, or MACD for short, is like a special pair of glasses that lets you see beneath the surface of stock market waves. Imagine you’re at the beach, watching waves come and go.
Some waves are big, others are small, and it’s all a bit chaotic. Now, imagine you could wear glasses that show you the pattern of these waves, making it easier to predict when the next big wave will hit. That’s what the MACD does for the stock market.
In simpler terms, the MACD takes two lines (these represent different moving averages of a stock’s price) and watches how they move together or apart. When these lines come together, converge, or move apart, diverge, they tell us something about the stock’s current energy and momentum.
It’s a bit like knowing whether to surf a wave or wait for a better one.
Why Calculate the MACD?
Calculating the MACD is essential because it’s like having a weather forecast for the stock market. Just as you would check the weather before heading out to surf, you check the MACD before making trading decisions. Here’s why it’s so helpful:
- Trend Spotting: The MACD helps you see the bigger picture, showing whether the market’s mood is positive (bullish) or negative (bearish).
- Momentum Gauge: It tells you whether a stock’s movement is strong or weakening. This is crucial for deciding when to enter or exit trades.
- Signal for Buying or Selling: When the MACD lines cross in certain ways, they can signal the best times to buy or sell stocks.
Imagine you’re planning to buy a stock. By looking at the MACD, you notice the lines are about to cross in a way that historically suggests the stock’s price might go up. This signal helps you decide it’s a good time to buy.
How Does the MACD Assist You?
The MACD assists you by acting as a personal trading assistant, quietly analyzing the ebb and flow of stock prices to provide clear signals. Here’s an example of how it might help:
Let’s say you own shares in a company called “Bright Future Solar.” You’ve noticed the stock price has been going up and down, and you’re unsure whether to hold onto your shares or sell them.
You look at the MACD for “Bright Future Solar” and see two things:
- The MACD line crosses above the signal line: This is often a buy signal, suggesting that the stock’s price might continue to rise.
- The MACD bars are increasing in height: This indicates that the trend is gaining strength, giving you more confidence in your decision to hold onto your shares, expecting the price may go higher.
In this way, the MACD helps you make more informed decisions, reducing guesswork and enhancing your trading strategy with solid, visual evidence of what’s happening beneath the surface of stock prices.
How to Use the Free Excel MACD Calculator
Unblock File and Enable Macros
After downloading the file you may have to unblock the file as it contains macros.
To do so navigate to your Downloaded copy of the Excel MACD Calculator, right-click on the file and select ‘Properties‘.
At the bottom of the ‘Properties‘ box you’ll find the ‘Security‘ section, ensure the ‘Unblock‘ box is checked and click ‘Apply‘ then ‘OK‘.

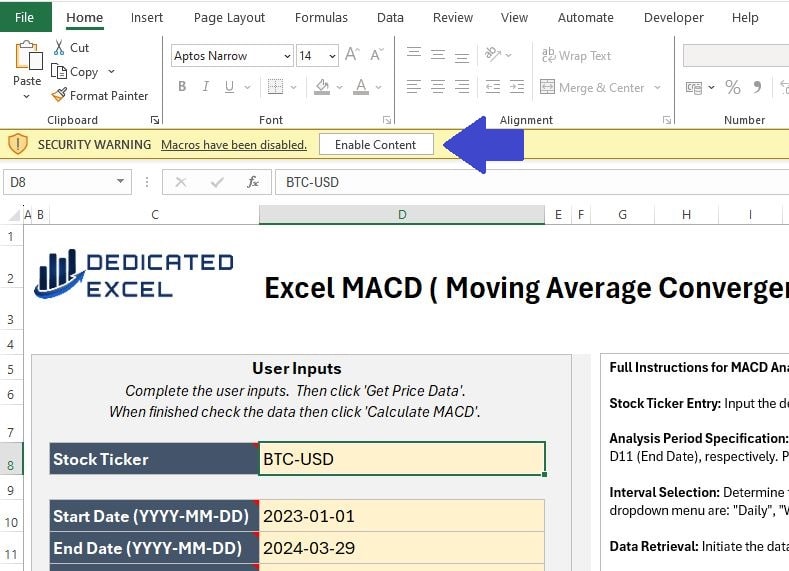
When you open the Excel MACD Calculator, a prompt will appear asking you to ‘Enable Content’.
By clicking this, you activate the macros responsible for importing stock prices and executing the MACD calculations, ensuring the tool functions as intended.
Complete User Inputs
The next step is to complete the User Input section.
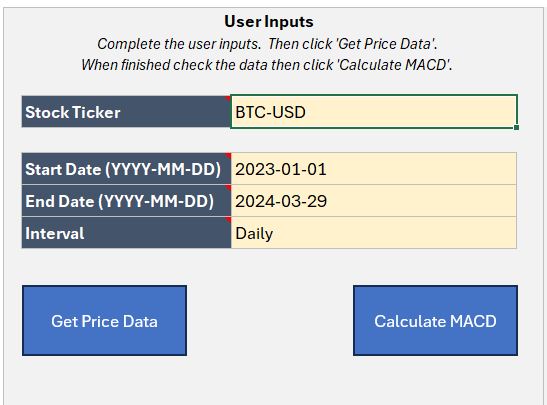
There are four inputs to complete, designed so you can tailor your MACD analysis to suit your needs:
- Stock Ticker: Input the ticker symbol for the stock, or cryptocurrency, to analyse. For example CVX is the ticker symbol for Chevron, MSFT is the ticker for Microsoft or BTC-USD is the Bitcoin USD price. If you don’t know the ticker symbol you can look it up on financial sites like yahoo finance.
- Start Date: Enter the Start Date for the period you wish to analyse. The Date must be entered in YYYY-MM-DD format, including the dashes for seperating.
- End Date: Enter the End Date for the period you wish to analyse. The Date must be entered in YYYY-MM-DD format, including the dashes for seperating. Note that Prices are generally updated on weekdays (with the exception of Cryptocurrencies) and to get a closing price the stockmarket must have finished trading for the day.
- Interval: Select an Interval for the Prices using the dropdown. You can choose from Daily, Weekly or Monthly Prices.
Get Price Data
After inputting your information in the User Inputs area, the first step of the analysis is to click the ‘Get Price Data‘ button. This action will bring in the Price data based on the criteria you’ve set.
It’s essential to ensure that the ‘Price Data‘ worksheet is populated with the appropriate data before moving forward. This step is to confirm that Excel has accurately imported the data required for your analysis.
Keep in mind that by clicking the ‘Get Price Data‘ button, Excel will clear any existing worksheets or charts to prepare for the new analysis.
There’s no need to manually remove worksheets; simply enter your updated data and embark on a fresh analysis.
Calculate MACD
The final step is to click on the ‘Calculate MACD‘ button.
This will perform the MACD analysis for your imported prices and produce four chart outputs.
What Do the Excel MACD Calculator Outputs Show?
There are four outputs to the Excel MACD Calculator:
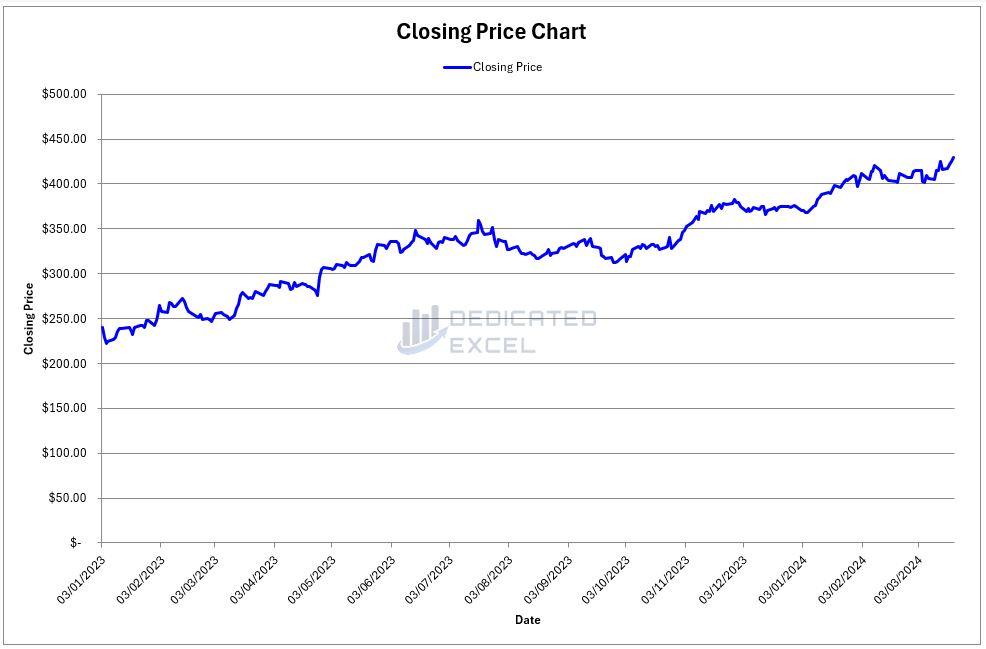
Price Line Chart
The Price Line Chart presents a clear picture of a stock’s closing prices over a chosen period.
It plots these end-of-day values with a seamless line, offering an immediate visual summary of the stock’s journey.
This chart’s straightforward nature enables fast evaluation of price movements, serving as an effective tool for identifying the overall direction in which the stock is trending.
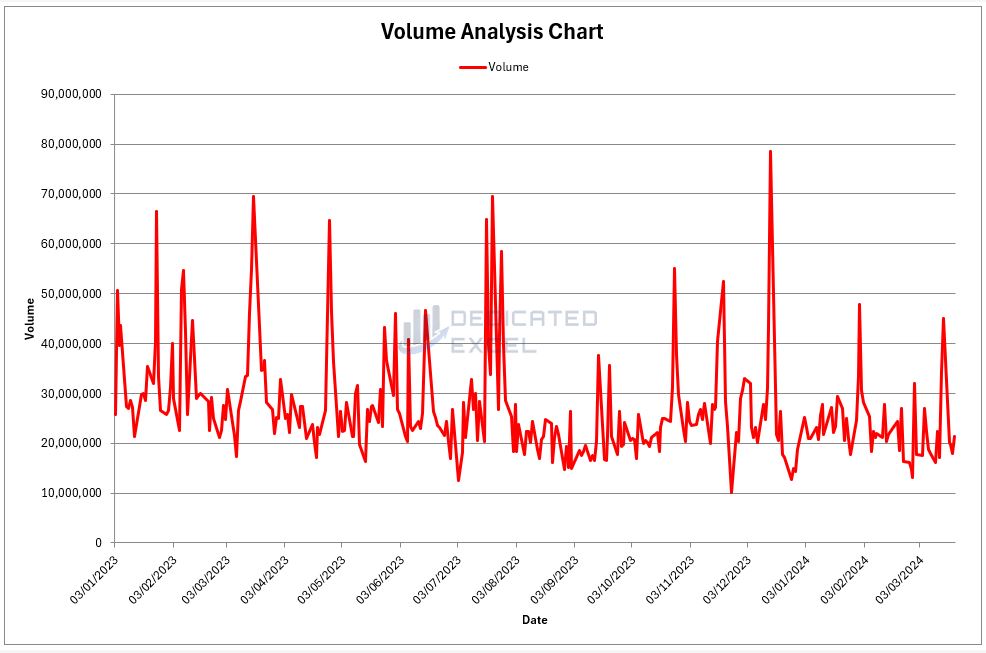
Volume Line Chart
The Volume Line Chart tracks the number of shares traded during each specified period within your selected timeframe.
It emphasizes the stock’s trading activity and liquidity, providing insights into how actively it’s being bought and sold.
High-volume periods often reflect strong interest and significant price movements, while low-volume times may suggest less trading activity and potential periods of price stabilization.
Understanding these volume patterns is essential for gauging market sentiment and momentum, giving you a fuller view of the trading landscape.
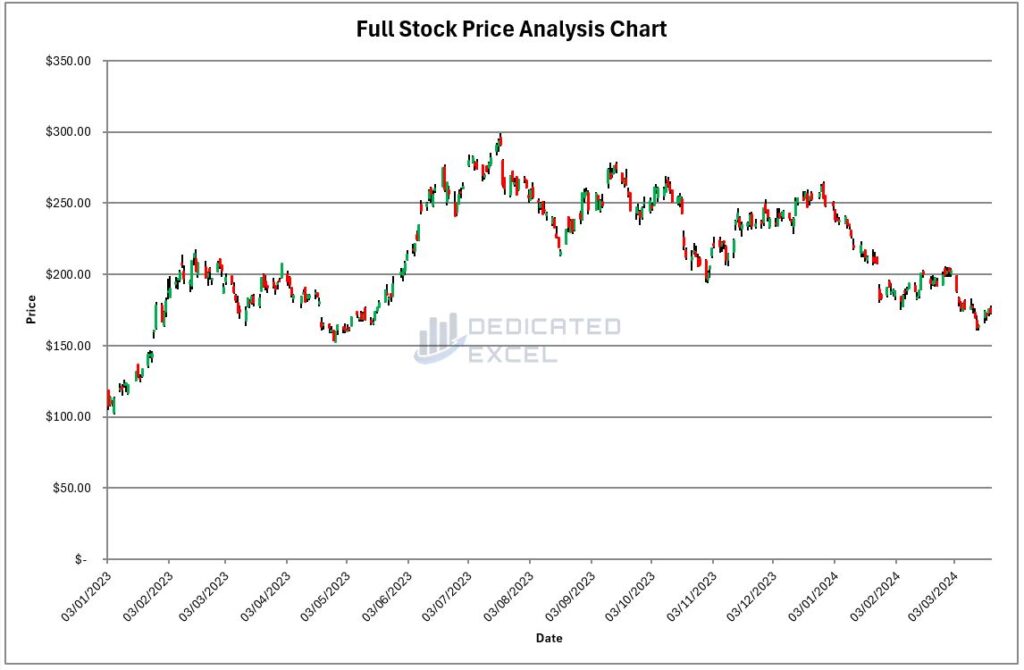
Full Price Chart
The Full Price Chart, often referred to as an OHLC (Open, High, Low, Close) Chart, offers an in-depth snapshot of a stock’s price movements.
Every bar displayed encapsulates the price fluctuation for a specific timeframe, with green bars denoting periods where the close was above the open (indicative of upward movement), and red bars signaling periods where the close was below the open (indicative of downward movement).
This method of color-coding aids in swiftly pinpointing positive (bullish) or negative (bearish) trends, as well as assessing the stock’s volatility during each interval.
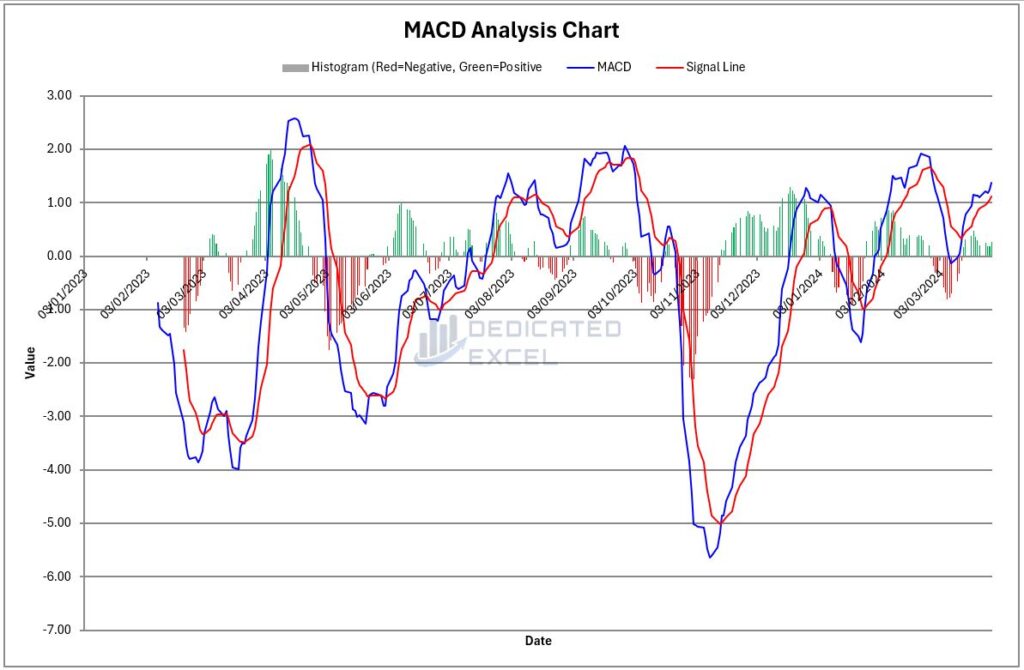
MACD Chart
The MACD Chart is a dynamic tool that charts the relationship between two crucial elements in trading analysis: the MACD line (in blue) and the Signal line (in red). Additionally, it incorporates a histogram that visually represents the momentum of the stock with colored bars—green for positive momentum and red for negative.
At its core, the MACD line is calculated from the difference between two moving averages of a stock’s price, typically over 12 and 26 days. The Signal line, on the other hand, is a moving average of the MACD line itself, usually over 9 days.
This setup allows traders to see how the two lines interact over time, providing insights into potential buy or sell signals.
The histogram is particularly telling; it measures the distance between the MACD line and the Signal line. When the MACD line crosses above the Signal line, the histogram will show green bars, indicating positive momentum and potentially a good time to buy.
Conversely, when the MACD line crosses below the Signal line, red bars appear on the histogram, suggesting negative momentum and possibly a time to sell.
Together, these components of the MACD Chart offer a multifaceted view of a stock’s price action, revealing trends, momentum, and reversals through the interplay of lines and colors.
This chart helps traders visualize the stock’s behavior, making it easier to predict future movements and make informed trading decisions.
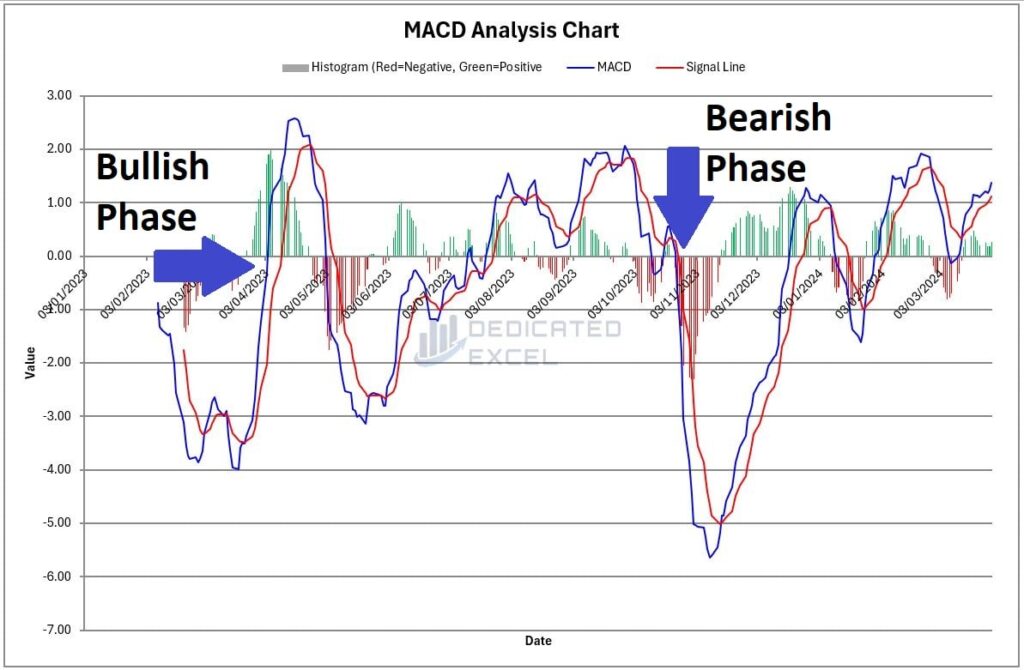
Interpreting the MACD Results
Understanding the MACD results means learning to read the signals provided by the MACD line, the Signal line, and the histogram. Each element offers unique insights:
- MACD Line Crossing the Signal Line: This is the heart of the MACD analysis. A crossing above the Signal line suggests bullish momentum and could be a buying signal. Conversely, a crossing below indicates bearish momentum, potentially signaling a sell.
- Position Relative to Zero Line: The MACD’s position relative to the zero line adds another layer of analysis. Being above the zero line indicates overall bullish conditions, while below suggests bearish conditions.
- Histogram Dynamics: The histogram’s size and direction signal the strength of the trend. Increasing green bars indicate strengthening bullish trends, while growing red bars highlight stronger bearish trends. A shrinking histogram suggests a weakening trend or potential reversal.
By piecing together these signals, traders can form a comprehensive view of market sentiment and momentum, aiding in decision-making processes.
Practical Example of Using the MACD Chart in Trading
Let’s apply the MACD Chart to a hypothetical trading scenario with a stock named “Tech Innovate.”
Imagine “Tech Innovate” has been on an upward trend, and you’re considering whether to hold onto your shares or sell. You turn to the MACD Chart for insight. You notice the following:
- The MACD line has just crossed above the Signal line, and it’s above the zero line. This crossing happened recently, not far from the zero line, suggesting the start of a new bullish trend.
- The histogram shows small but increasing green bars, confirming the bullish momentum indicated by the MACD line’s crossing.
Based on this analysis, you decide it’s not yet time to sell. Instead, it might even be a good opportunity to buy more shares, expecting the bullish trend to continue and push the stock’s price higher.
A week later, the trend continues as anticipated. The green bars in the histogram grow taller, and the MACD line remains above the Signal line, reinforcing your decision to hold or buy more shares.
This example illustrates how interpreting the MACD Chart can guide trading decisions, offering a practical tool to assess market trends and momentum.
Troubleshooting Common Issues
The Excel MACD Calculator is designed with advanced error-handling features to give you clear guidance on fixing common problems.
Here are some tips for dealing with these issues:
- Activating Macros: When you start the Excel MACD Calculator, make sure to enable Macros. Macros are crucial for the calculator’s functionality, allowing it to bring in stock price data and carry out the MACD calculations. Without Macros, the calculator won’t be able to do its job.
- Check Your Inputs: Make sure all required fields are correctly filled in, paying close attention to the format needed, especially for dates. Wrong or incomplete inputs can mess up the analysis.
- Ticker Symbol Accuracy: Make sure the stock ticker symbol is correct. If the ‘Price Data’ worksheet doesn’t show any data after you hit the ‘Get Price Data’ button, it might be because the ticker symbol is wrong or not formatted properly.
- StockHistory Function Problems: Sometimes, the StockHistory function, which the calculator uses to get data, might not work right. This could be because of things like a bad internet connection or service interruptions.
- Gaps in Charts: You might see gaps in the charts, especially with stocks from the UK and Europe, because of days the market was closed, leading to a #N/A error. The calculator accounts for these gaps in its calculations, but they might still show up in the charts.
If you’re still having trouble after trying the above fixes, here are a few more things to try:
- Restart Your System: Restarting your computer can solve many small issues that affect how Excel works.
- Reopen the Calculator: Close the Excel MACD Calculator and then open it again, making sure your internet connection is good, to reset its connection to data sources.
Free Download of the Excel MACD Calculator
Download Free Excel MACD CalculatorSummary
In summary, the MACD Chart serves as a powerful tool in the arsenal of both novice and experienced traders, providing clear signals on market trends and momentum through its clever use of crossing lines and color-coded histograms.
By understanding how to interpret these signals, traders can make more informed decisions, potentially leading to better trading outcomes.
However, while the MACD offers valuable insights, it’s important to remember that no indicator should be used in isolation.
Combining the MACD with other trading indicators, such as the Guppy Multiple Moving Average (GMMA), the Relative Strength Index (RSI), and the Average True Range (ATR), can offer a more rounded view of the market.
This multi-faceted approach can help in identifying more reliable trading opportunities by confirming signals across different indicators.
For those looking to deepen their analysis, I also provide other free Excel Calculators for trading analysis:
- Excel Dollar Cost Averaging Calculator
- Excel RSI Calculator (Relative Strength Index)
- Excel GMMA Calculator (Guppy Multiple Moving Average)
- Excel ATR Calculator (Average True Range)
Integrating these tools into your trading strategy can enhance your market analysis, giving you a competitive edge. Remember, the goal is to build a robust trading strategy that can withstand the test of market volatility, and using a combination of indicators is a step in the right direction.
Keep Excelling,

Disclaimer: Please note this is not a tool aimed at providing financial advice, it merely showcases features of the Microsoft Excel software package.
The free MACD calculator in Excel relies on external data sources for prices and performs various calculations, none of which have been independently validated. Please consult a qualified financial advisor before making any investments.
This file may not be published on other websites or file sharing services without written consent from the owner.
Curious about unveiling hidden patterns in your data with a visual twist? Dive into our next post, “How to Create a Contour Chart in Excel,” where we unlock the secrets of transforming numerical data into a landscape of peaks and valleys. Discover a step-by-step guide that demystifies the process, making it accessible for everyone.