
Are you looking to enhance your trading strategies with a reliable tool for monitoring stock market volatility? The Excel Bollinger Bands Calculator is here to make a difference.
This innovative tool caters to both emerging and veteran traders, offering a simplified approach to leveraging Bollinger Bands in Excel.
Known for their effectiveness in identifying market volatility and trend opportunities, Bollinger Bands are indispensable for traders aiming to capitalize on market movements.
This Free Excel Bollinger Bands Calculator strips away the complexity of advanced trading platforms and manual calculations, making it easier to navigate the often volatile trading environment.
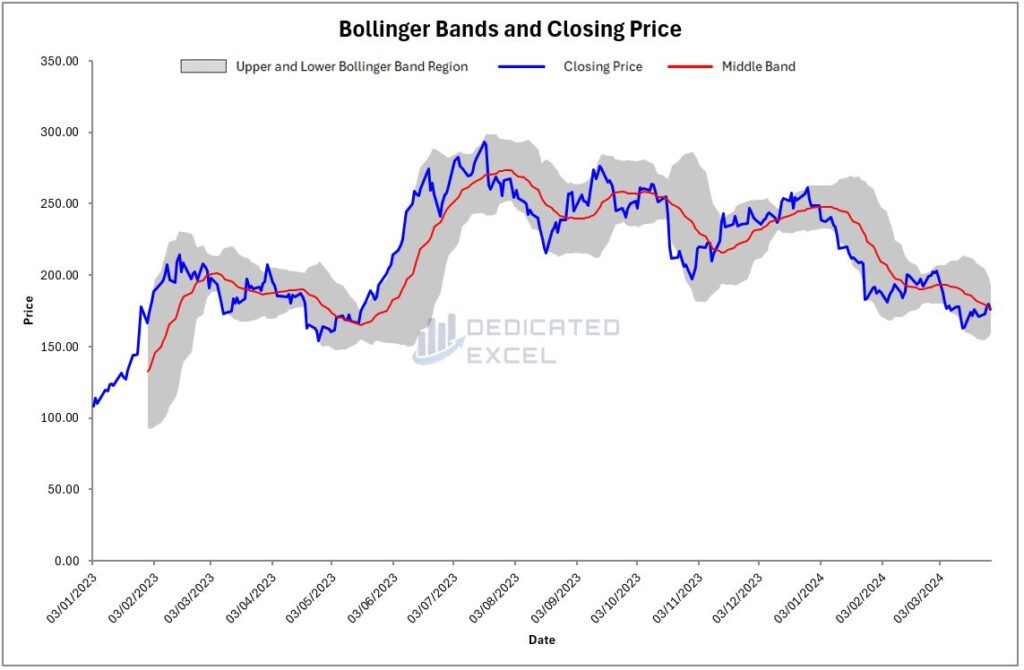
Table of Contents
- What Are Bollinger Bands?
- Why Calculate Bollinger Bands?
- How Can Bollinger Bands Assist You with Trading?
- How to Use the Free Excel Bollinger Calculator
- What Do the Excel Bollinger Bands Calculator Outputs Show?
- How Are the Bollinger Bands Calculated?
- Useful Signals from The Bollinger Bands Chart
- Troubleshooting Common Issues
- Free Download of the Excel Bollinger Bands Calculator
- Summary
What Are Bollinger Bands?
Bollinger Bands, a concept developed by John Bollinger in the 1980s, are a technical analysis tool designed to provide traders with insights into stock market volatility and price trends.
Essentially, they consist of three lines: the middle line is a moving average (typically a 20-day simple moving average), and the two outer bands adjust their distance from the middle line based on market volatility, calculated using standard deviation.
This adjustment means the bands widen during periods of high volatility and contract during times of low volatility, creating a dynamic envelope around price movement.
For beginners, imagine you’re observing a rubber band stretching and contracting around the price of a stock. This elasticity is akin to Bollinger Bands in the Excel Bollinger Bands calculator, visually indicating when the stock might be overbought (stretching) or oversold (contracting) based on its typical price movements.
Why Calculate Bollinger Bands?
Calculating Bollinger Bands allows traders to assess market conditions more accurately and make informed decisions.
By understanding where the current price sits within these bands, traders can gauge if a stock is potentially overvalued (trading above the upper band) or undervalued (below the lower band). This insight is invaluable for deciding when to enter or exit trades.
Using the Excel Bollinger Bands calculator simplifies this process, enabling traders to input historical price data and automatically compute the bands.
For example, if you notice that a stock price has repeatedly bounced off the lower band and started moving upwards, it might indicate a good buying opportunity, suggesting the stock is undervalued and likely to increase in price.
How Can Bollinger Bands Assist You with Trading?
Bollinger Bands can be a powerful ally in your trading strategy by providing clear signals about market behavior.
For instance, a common trading strategy is the ‘Bollinger Squeeze’, where a narrowing of the bands suggests that a significant price move is imminent. Traders watch for a breakout above or below the bands as a signal to buy or sell.
Consider a scenario where you’re using the Excel Bollinger Bands to monitor a particular stock.
You notice the bands are tightening significantly, indicating decreased volatility and a potential breakout.
If the stock price breaks above the upper band, it could be a signal to buy, anticipating further upward movement. Conversely, if the price falls below the lower band, it might be a cue to sell.
By integrating Excel Bollinger Bands into your trading toolkit, you can harness these insights without deep diving into complex calculations, making it easier to spot opportunities and manage risks even if you’re just starting out in the trading world.
How to Use the Free Excel Bollinger Calculator
Unblock File and Enable Macros
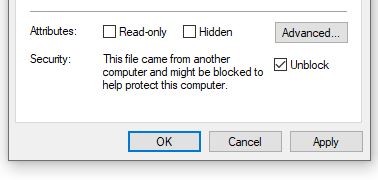
After downloading the file you may have to unblock the file as it contains macros.
To do so navigate to your Downloaded copy of the Excel Bollinger Calculator, right-click on the file and select ‘Properties‘.
At the bottom of the ‘Properties‘ box you’ll find the ‘Security‘ section, ensure the ‘Unblock‘ box is checked and click ‘Apply‘ then ‘OK‘.
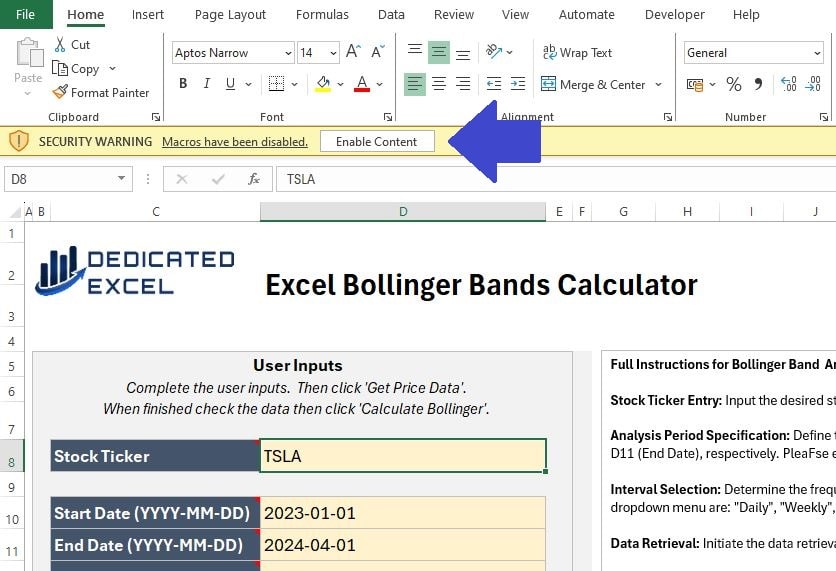
When you open the Excel Bollinger Calculator, a prompt will appear asking you to ‘Enable Content’.
By clicking this, you activate the macros responsible for importing stock prices and executing the Bollinger calculations, ensuring the tool functions as intended.
Complete User Inputs
The next step is to complete the User Input section.
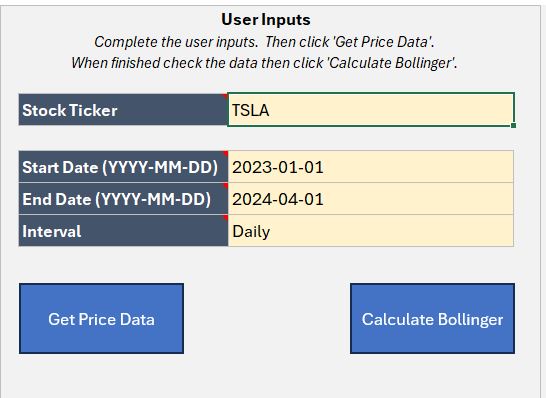
There are four inputs to complete, designed so you can tailor your Bollinger Band analysis to suit your needs:
- Stock Ticker: Input the ticker symbol for the stock, or cryptocurrency, to analyse. For example TSLA is the ticker symbol for Tesla, MSFT is the ticker for Microsoft or ETH-USD is the Ethereum USD price. If you don’t know the ticker symbol you can look it up on financial sites like yahoo finance.
- Start Date: Enter the Start Date for the period you wish to analyse. The Date must be entered in YYYY-MM-DD format, including the dashes for seperating.
- End Date: Enter the End Date for the period you wish to analyse. The Date must be entered in YYYY-MM-DD format, including the dashes for seperating. Note that Prices are generally updated on weekdays (with the exception of Cryptocurrencies) and to get a closing price the stockmarket must have finished trading for the day.
- Interval: Select an Interval for the Prices using the dropdown. You can choose from Daily, Weekly or Monthly Prices.
Get Price Data
After inputting your information in the User Inputs area, the first step of the analysis is to click the ‘Get Price Data‘ button. This action will bring in the Price data based on the criteria you’ve set.
It’s essential to ensure that the ‘Price Data‘ worksheet is populated with the appropriate data before moving forward. This step is to confirm that Excel has accurately imported the data required for your analysis.
Keep in mind that by clicking the ‘Get Price Data‘ button, Excel will clear any existing worksheets or charts to prepare for the new analysis.
There’s no need to manually remove worksheets; simply enter your updated data and embark on a fresh analysis.
Calculate Bollinger
The final step is to click on the ‘Calculate Bollinger‘ button.
This will perform the Bollinger Band analysis for your imported prices and produce four chart outputs.
What Do the Excel Bollinger Bands Calculator Outputs Show?
There are four outputs to the Excel Bollinger Bands Calculator:
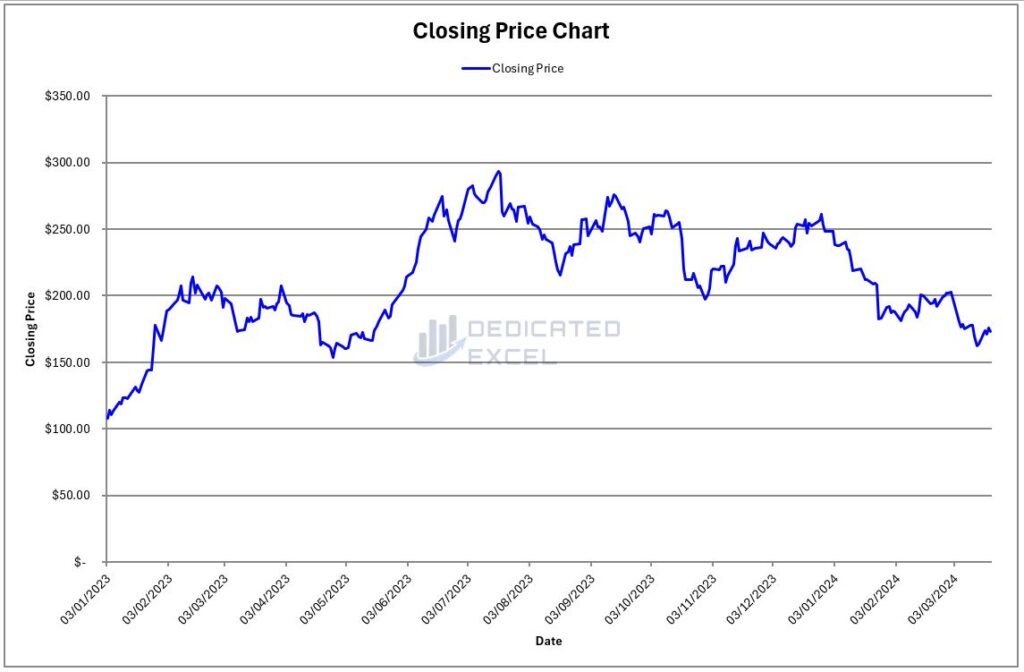
Price Line Chart
The Price Line Chart shows how a stock’s closing prices change over time.
It draws a line through these daily closing prices, giving you a simple look at how the stock has moved. Because it’s easy to understand, you can quickly see if the stock’s price is generally going up or down.
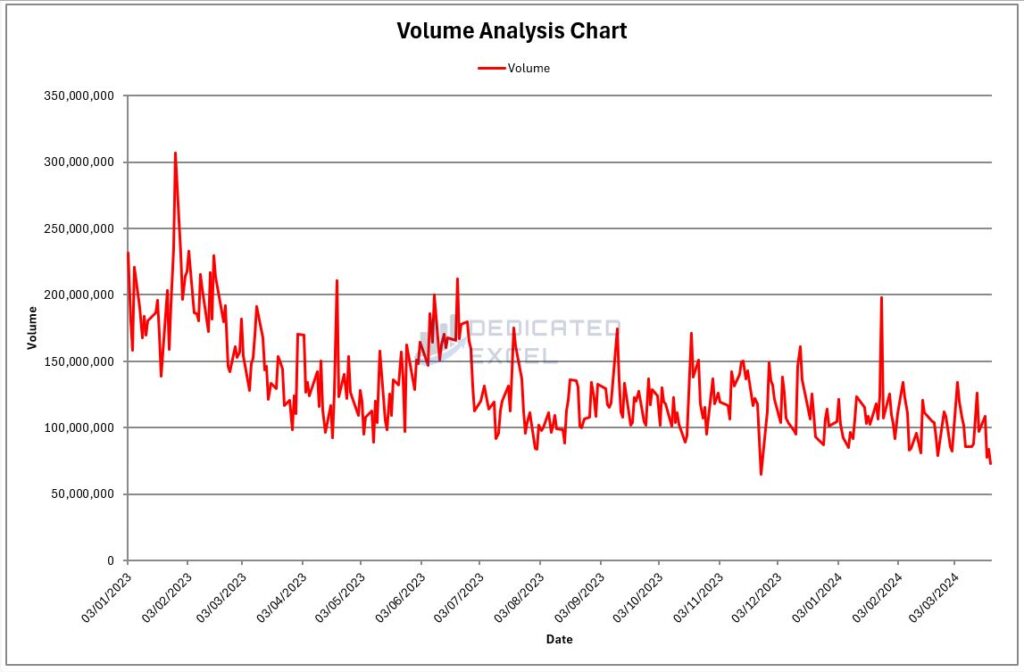
Volume Line Chart
The Volume Line Chart shows how many shares of a stock are traded over time within the period you choose.
It highlights how much the stock is being traded, giving you an idea of its popularity and ease of buying or selling.
Times with lots of trading often mean many people are interested and prices might be changing a lot. When there’s less trading, it might mean not much is happening and prices could be more stable.
Knowing about these trading amounts helps you understand what people think about the stock and if it’s gaining or losing momentum, offering a clearer picture of what’s going on in the market.
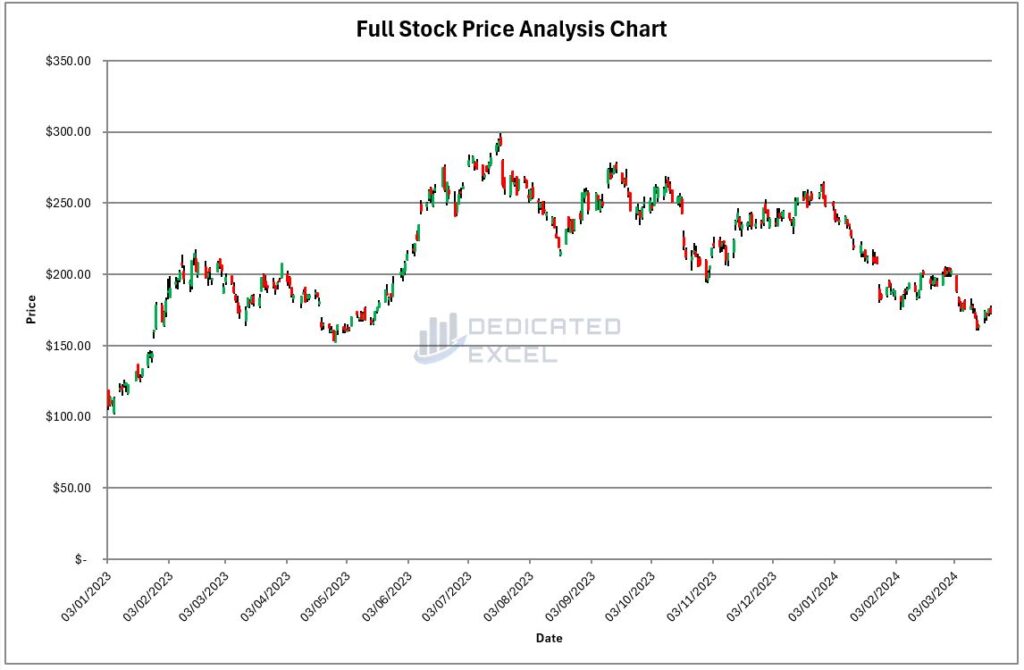
Full Price Chart
The Full Price Chart, also known as an OHLC (Open, High, Low, Close) Chart, gives a detailed view of how a stock’s price changes.
Each bar on the chart shows the range of prices within a certain period. Green bars mean the closing price was higher than the opening price (showing prices went up), and red bars mean the closing price was lower (showing prices went down).
This use of colors makes it easy to spot whether the stock is generally moving up or down and to see how much the price changes from one period to the next.
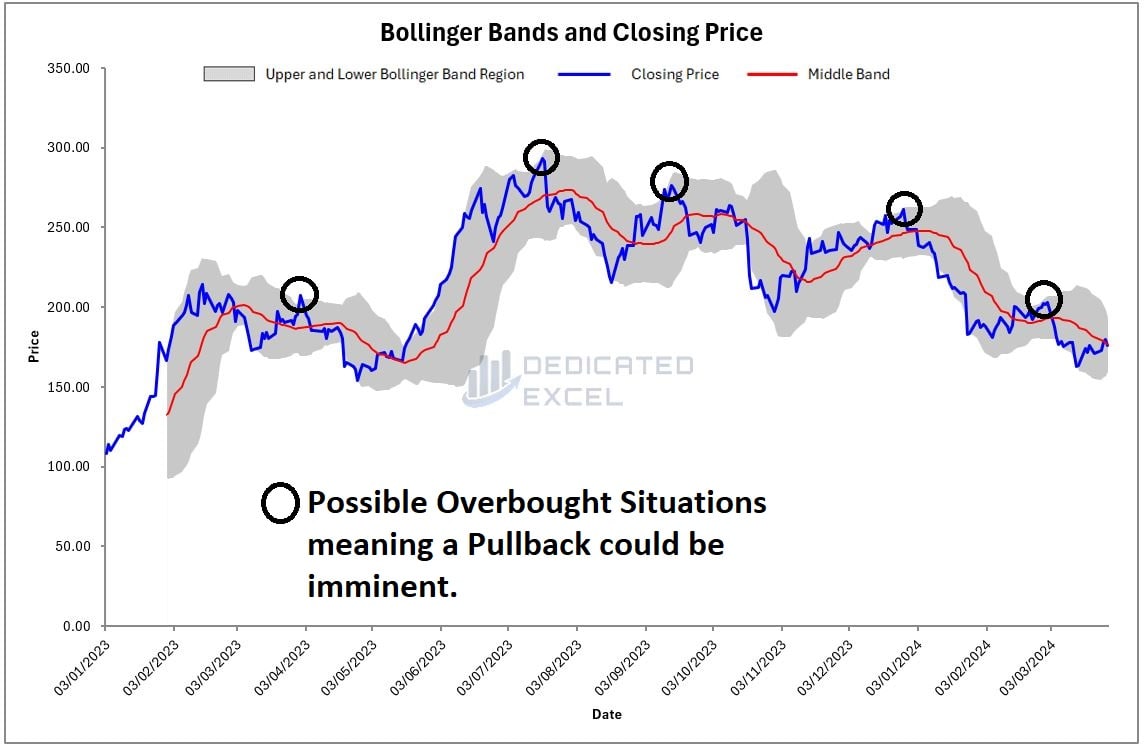
Bollinger Bands Chart
The Bollinger Bands Chart is designed to offer a detailed perspective on stock price movements in relation to its volatility. Here’s a breakdown of its components:
- Blue Line: This line reflects the closing price of the stock over time, allowing observers to track the end-of-day price movements.
- Red Line: Represents the Middle Band, this is a simple moving average calculated over the previous 20 periods. It acts as a benchmark for the stock’s trend over a longer term.
- Grey Shaded Region: This illustrates the area between the upper and lower Bollinger Bands, defining the Bollinger channel. The fluctuation in the width of this channel highlights changes in volatility, with a wider channel indicating increased volatility and a narrower one suggesting reduced volatility.
How Are the Bollinger Bands Calculated?
Bollinger Bands are a crucial tool for traders aiming to analyze market volatility and potential price movements. At the heart of this technique is the Middle Band, typically a 20-period Simple Moving Average (SMA) of the closing prices, which serves as a baseline.
The periods are based on the interval chosen for the analysis, either days, weeks or months.
Here’s a step-by-step breakdown of how the Upper and Lower Bollinger Bands are calculated from this central point:
- Middle Band Calculation: The Middle Band is created by calculating the average closing price of the stock over the past 20 periods. This provides a smoothed-out baseline that reflects the ongoing trend of the stock’s price.
- Standard Deviation Measurement: The next step involves measuring the standard deviation of the stock’s closing prices over the same 20-periods. The standard deviation is a statistical metric that quantifies the dispersion of a dataset relative to its mean. In the context of Bollinger Bands, it helps to assess the stock’s volatility — the degree to which the stock price fluctuates.
- Upper Band Calculation: To determine the Upper Band, you add two standard deviations to the Middle Band. This calculation predicts the upper limit of price fluctuations based on recent volatility, indicating where the stock price is considered relatively high. The formula looks like this:
Upper Band = Middle Band + (2 * Standard Deviation) - Lower Band Calculation: Conversely, the Lower Band is calculated by subtracting two standard deviations from the Middle Band. This shows the lower limit of price movements, below which the stock price is deemed relatively low, as per the formula:
Lower Band = Middle Band – (2 * Standard Deviation).
The choice of two standard deviations is conventional, covering approximately 95% of the price movement scenarios under a normal distribution.
This setup means that the bands adjust with the stock’s volatility: they widen during periods of high volatility and narrow during low volatility phases.
Useful Signals from The Bollinger Bands Chart
- Touching the Upper Band: When the blue line approaches or touches the upper limit of the grey shaded region, it might suggest that the stock is overbought, possibly leading to a price correction or stabilization.

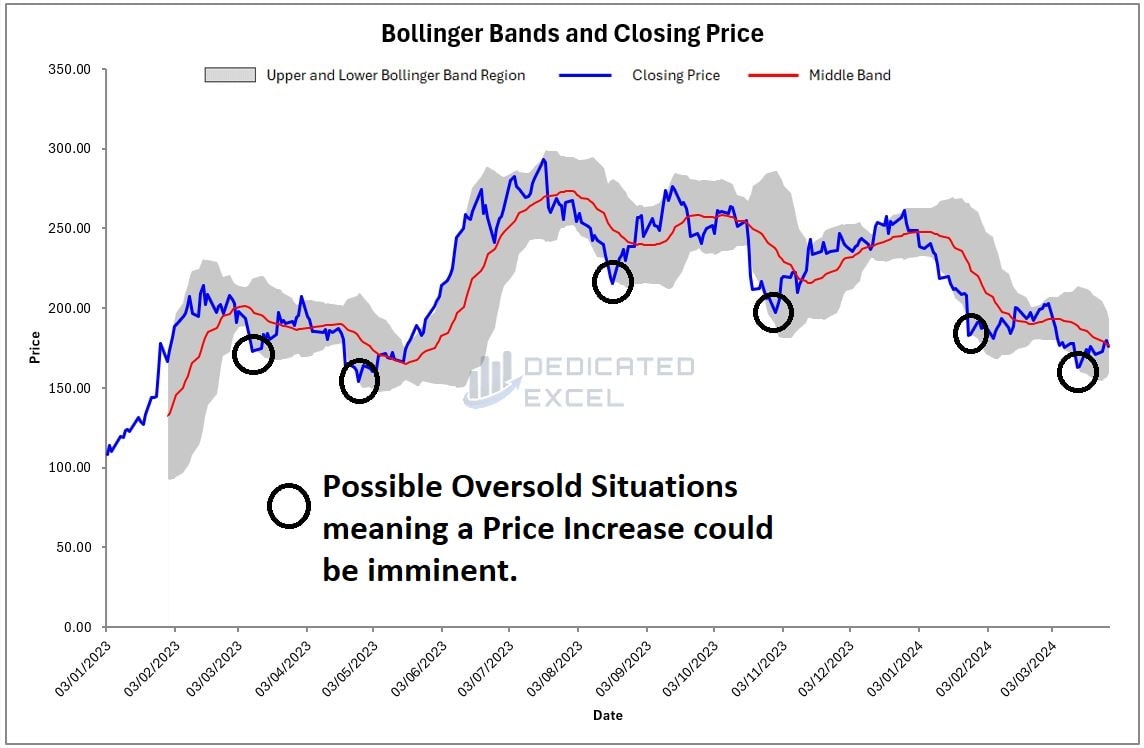
- Touching the Lower Band: If the blue line reaches or touches the lower edge of the grey shaded area, it may indicate that the stock is oversold, potentially offering a buying opportunity in anticipation of a price increase.

- Band Squeeze: A squeeze, or narrowing of the grey shaded region, signifies low volatility, often preceding a significant price movement. The direction of the price breakout from this squeeze can indicate the start of a new trend.
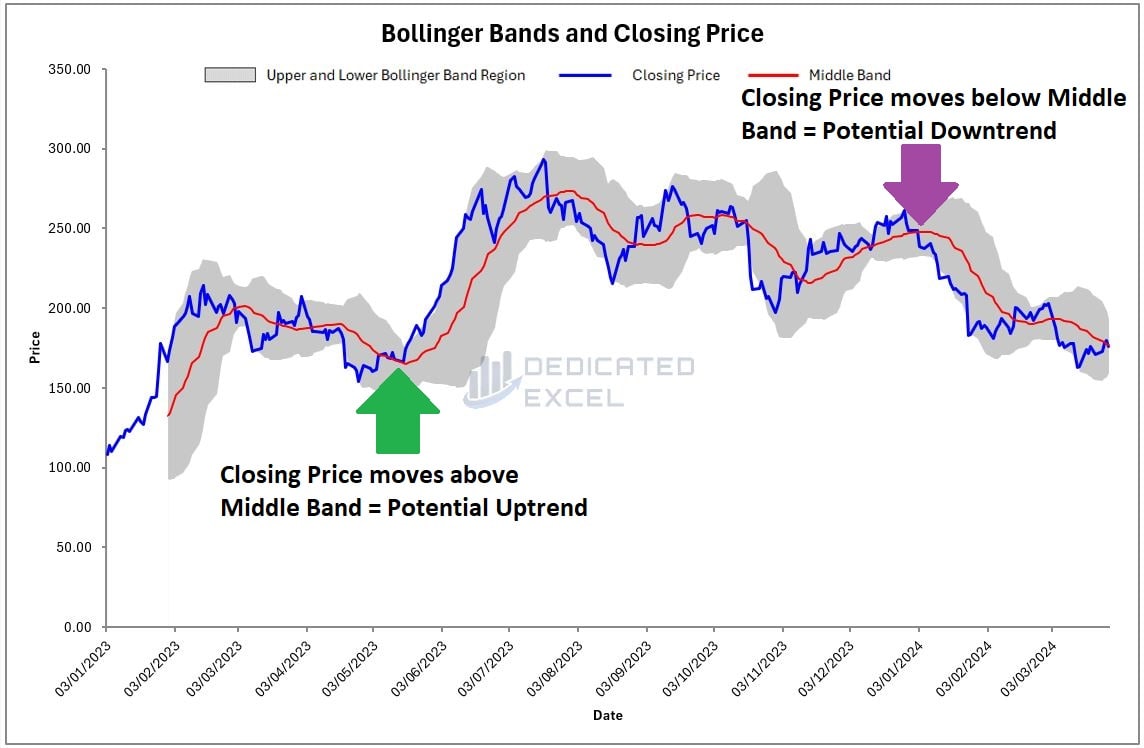
- Crossing the Middle Band: A movement of the blue line across the red line (Middle Band) can signal a shift in trend. A move above the red line suggests the possibility of an uptrend, whereas a move below it could hint at a downtrend.
- Width of the Bands: Observing the width of the grey shaded region provides insights into market volatility. Wide bands reflect high volatility, and narrow bands indicate low volatility, with changes in the width offering clues about potential shifts in market sentiment.
Understanding these elements and signals can enhance the interpretation of the Bollinger Bands Chart, aiding in making more informed decisions based on stock price movements and market volatility.
Troubleshooting Common Issues
The Excel Bollinger Bands Calculator is designed with advanced error-handling features to give you clear guidance on fixing common problems.
Here are some tips for dealing with any issues:
- Activating Macros: When you start the Excel Bollinger Bands Calculator, make sure to enable Macros. Macros are crucial for the calculator’s functionality, allowing it to bring in stock price data and carry out the Bollinger Bands calculations. Without Macros, the calculator won’t be able to do its job.
- Check Your Inputs: Make sure all required fields are correctly filled in, paying close attention to the format needed, especially for dates. Wrong or incomplete inputs can mess up the analysis.
- Ticker Symbol Accuracy: Make sure the stock ticker symbol is correct. If the ‘Price Data’ worksheet doesn’t show any data after you hit the ‘Get Price Data’ button, it might be because the ticker symbol is wrong or not formatted properly.
- StockHistory Function Problems: Sometimes, the StockHistory function, which the calculator uses to get data, might not work right. This could be because of things like a bad internet connection or service interruptions.
- Gaps in Charts: You might see gaps in the charts, especially with stocks from the UK and Europe, because of days the market was closed, leading to a #N/A error. The calculator accounts for these gaps in its calculations, but they might still show up in the charts.
If you’re still having trouble after trying the above fixes, here are a few more things to try:
- Restart Your System: Restarting your computer can solve many small issues that affect how Excel works.
- Reopen the Calculator: Close the Excel Bollinger Bands Calculator and then open it again, making sure your internet connection is good, to reset its connection to data sources.
Free Download of the Excel Bollinger Bands Calculator
Download Free Excel Bollinger Bands CalculatorSummary
The Excel Bollinger Bands Calculator is an essential tool designed to simplify the process of analyzing stock market volatility for traders of all levels.
By utilizing the 20-periods Simple Moving Average (SMA) as the Middle Band and calculating the Upper and Lower Bands based on standard deviation, this calculator provides a dynamic view of stock price movements and volatility.
It enables users to easily identify potential buy or sell signals, assess market trends, and make informed trading decisions without the need for complex software.
Whether you’re a seasoned trader or just starting out, the Excel Bollinger Bands Calculator offers a straightforward way to incorporate advanced market analysis into your trading strategy, all from the convenience of an Excel spreadsheet.
However, while the Excel Bollinger Bands Calculator offers valuable insights, it’s important to remember that no indicator should be used in isolation. For this reason please consider downloading some of the other Free Excel Calculators provided on this site to use in conjunction with your analysis:
- Excel Dollar Cost Averaging Calculator
- Excel ATR Calculator (Average True Range)
- Excel MACD Calculator (Moving Average Convergence Divergence)
- Excel RSI Calculator (Relative Strength Index)
- Excel GMMA Calculator (Guppy Multiple Moving Average)
Integrating these tools into your trading strategy can enhance your market analysis, giving you a competitive edge.
Keep Excelling,

Disclaimer: Please note this is not a tool aimed at providing financial advice, it merely showcases features of the Microsoft Excel software package.
The Free Excel Bollinger Bands Calculator relies on external data sources for prices and performs various calculations, none of which have been independently validated. Please consult a qualified financial advisor before making any investments.
This file may not be published on other websites or file sharing services without written consent from the owner.
Ready to take your Excel skills to the next level? Discover how to automate your workflow by sending emails directly from Excel using VBA in our next post, How to Send Emails Using VBA. Unleash the power of Excel to enhance your productivity and communication efficiency. Don’t miss out on this essential guide to simplifying your tasks with just a few lines of code.