
Revolutionize your trading strategy with the Excel Keltner Channel Calculator, a must-have tool for navigating the ebbs and flows of stock market volatility.
Designed to serve both novice and seasoned traders, this calculator simplifies the application of Keltner Channels in Excel, enabling users to effortlessly integrate this powerful indicator into their trading toolkit.
Keltner Channels stand out for their precision in highlighting market volatility and signaling potential trading opportunities, making them an invaluable resource for traders keen on leveraging market trends to their advantage.
By offering a user-friendly interface, the Free Excel Keltner Channel Calculator demystifies complex trading analysis, ensuring you can focus on making informed decisions in a fluctuating trading landscape.
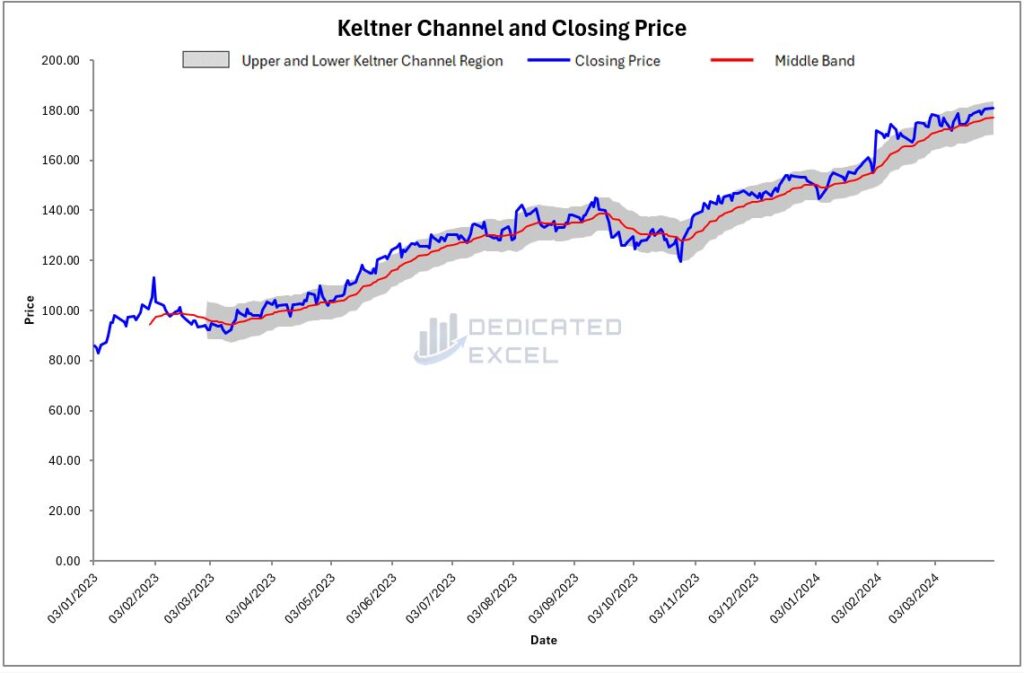
Table of Contents
- What is the Keltner Channel?
- Why Calculate the Keltner Channel?
- How Can The Keltner Channel Assist You with Trading?
- How Keltner Channels Differ From Bollinger Bands?
- How to Use the Free Excel Keltner Channel Calculator
- What Do the Excel Keltner Channel Calculator Outputs Show?
- How is the Keltner Channel Calculated?
- Useful Signals from The Keltner Channel Chart
- Download the Free Excel Keltner Channel Calculator
- Summary
What is the Keltner Channel?
The Keltner Channel is a technical analysis tool that encompasses a central moving average line, bordered by two bands, calculated from the average true range (ATR) of stock prices.
Originated by Chester W. Keltner in the 1960s, it has been refined over the years, particularly by Linda Bradford Raschke in the 1980s with the modern formula that incorporates ATR.
This indicator is used to identify potential reversal points by comparing the current price to the channel’s boundaries, providing insights into the market’s trend direction and volatility.
Why Calculate the Keltner Channel?
Calculating the Keltner Channel can significantly enhance your trading strategy by offering a clearer understanding of market trends and volatility.
It aids traders in identifying overbought and oversold conditions, potential breakouts, and retracements, thereby facilitating more informed decision-making.
Utilising the Keltner Channel allows for a disciplined approach to trading, helping to filter out the noise and focus on significant price movements that indicate real trading opportunities.
How Can The Keltner Channel Assist You with Trading?
The Keltner Channel assists traders by providing a visual representation of the price’s current position in relation to its average range, thus indicating whether a stock is potentially overbought (above the upper band) or oversold (below the lower band).
This information can be pivotal for setting entry and exit points. For instance, a trader might consider buying when the price moves back within the bands from below, suggesting a potential upward trend.
Conversely, selling signals might be identified when the price falls from the upper band back into the channel, indicating a possible downward movement.
Furthermore, the width of the channel itself can serve as an indicator of market volatility, with wider channels suggesting higher volatility.
How Keltner Channels Differ From Bollinger Bands?
While both Keltner Channels and Bollinger Bands aim to measure market volatility and trend direction, they differ fundamentally in their calculation and interpretation.
Bollinger Bands are calculated using a standard deviation of prices, making them more sensitive to sudden price changes and potentially leading to more false signals during periods of high volatility.
On the other hand, Keltner Channels use the Average True Range (ATR), providing a smoother indicator that is less prone to sudden spikes in volatility. This makes Keltner Channels particularly useful for traders looking for a more consistent measure of market movement, though it may also mean they are slower to signal changes compared to Bollinger Bands.
Understanding these differences is crucial for traders when choosing the tool that best fits their trading style and objectives.
How to Use the Free Excel Keltner Channel Calculator
Unblock File and Enable Macros
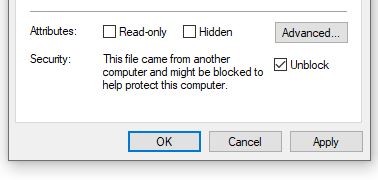
After downloading the file you may have to unblock the file as it contains macros.
To do so navigate to your Downloaded copy of the Excel Keltner Channel Calculator, right-click on the file and select ‘Properties‘.
At the bottom of the ‘Properties‘ box you’ll find the ‘Security‘ section, ensure the ‘Unblock‘ box is checked and click ‘Apply‘ then ‘OK‘.
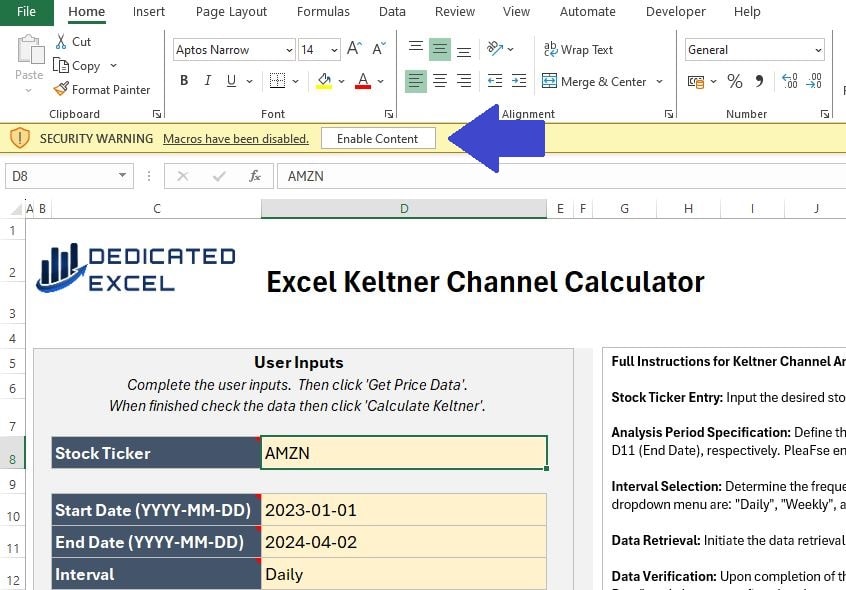
When you open the Excel Keltner Channel Calculator, a prompt will appear asking you to ‘Enable Content’.
By clicking this, you activate the macros responsible for importing stock prices and executing the Keltner Channel calculations, ensuring the tool functions as intended.
Complete User Inputs
The next step is to complete the User Input section.
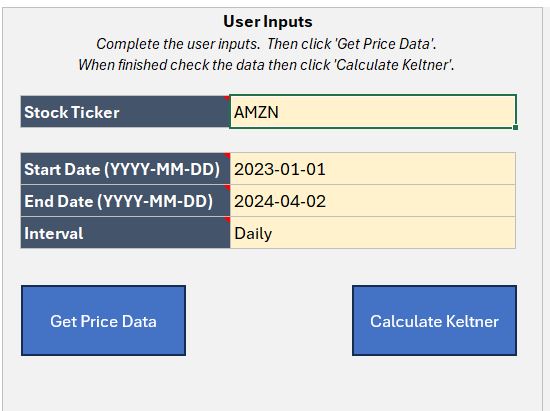
There are four inputs to complete, designed so you can tailor your Keltner Channel analysis to suit your needs:
- Stock Ticker: Input the ticker symbol for the stock, or cryptocurrency, to analyse. For example TSLA is the ticker symbol for Tesla, MSFT is the ticker for Microsoft or ETH-USD is the Ethereum USD price. If you don’t know the ticker symbol you can look it up on financial sites like yahoo finance.
- Start Date: Enter the Start Date for the period you wish to analyse. The Date must be entered in YYYY-MM-DD format, including the dashes for seperating.
- End Date: Enter the End Date for the period you wish to analyse. The Date must be entered in YYYY-MM-DD format, including the dashes for seperating. Note that Prices are generally updated on weekdays (with the exception of Cryptocurrencies) and to get a closing price the stockmarket must have finished trading for the day.
- Interval: Select an Interval for the Prices using the dropdown. You can choose from Daily, Weekly or Monthly Prices.
Get Price Data
After inputting your information in the User Inputs area, the first step of the analysis is to click the ‘Get Price Data‘ button. This action will bring in the Price data based on the criteria you’ve set.
It’s essential to ensure that the ‘Price Data‘ worksheet is populated with the appropriate data before moving forward. This step is to confirm that Excel has accurately imported the data required for your analysis.
Keep in mind that by clicking the ‘Get Price Data‘ button, Excel will clear any existing worksheets or charts to prepare for the new analysis.
There’s no need to manually remove worksheets; simply enter your updated data and embark on a fresh analysis.
Calculate Keltner
The final step is to click on the ‘Calculate Keltner‘ button.
This will perform the Keltner Channel analysis for your imported prices and produce four chart outputs.
What Do the Excel Keltner Channel Calculator Outputs Show?
There are four outputs to the Excel Keltner Channel Calculator:
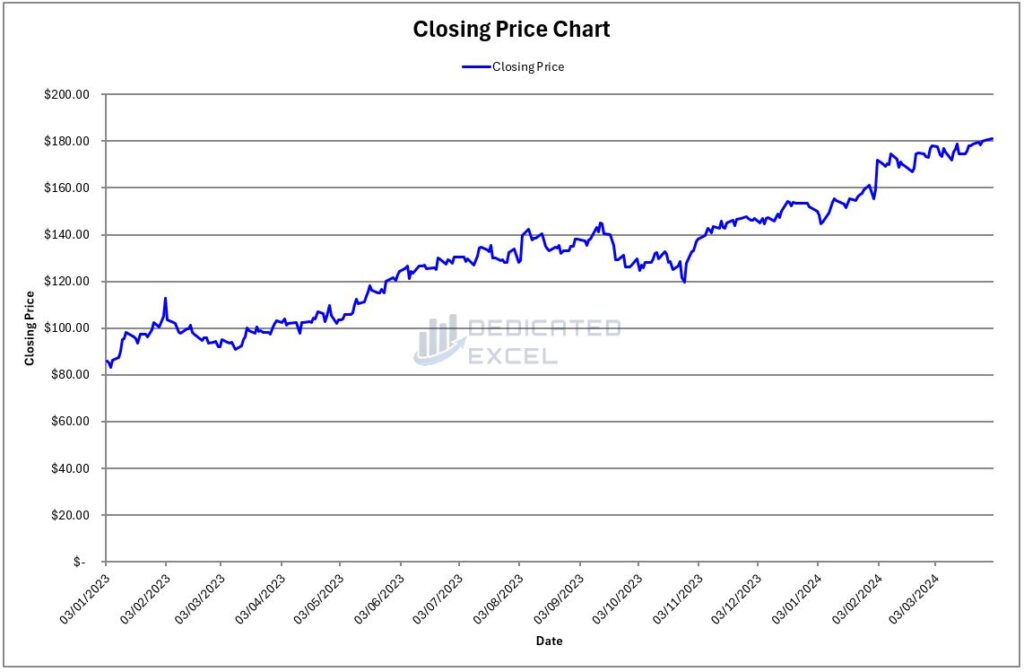
Price Line Chart
The Price Line Chart is a straightforward visual tool that traces the trajectory of a stock’s closing prices across a specified period.
By connecting each day’s closing prices with a continuous line, it offers a clear and concise view of the stock’s performance. This simplicity makes it incredibly accessible, allowing you to swiftly discern whether the stock’s value is on an upward trend or a downward slope.
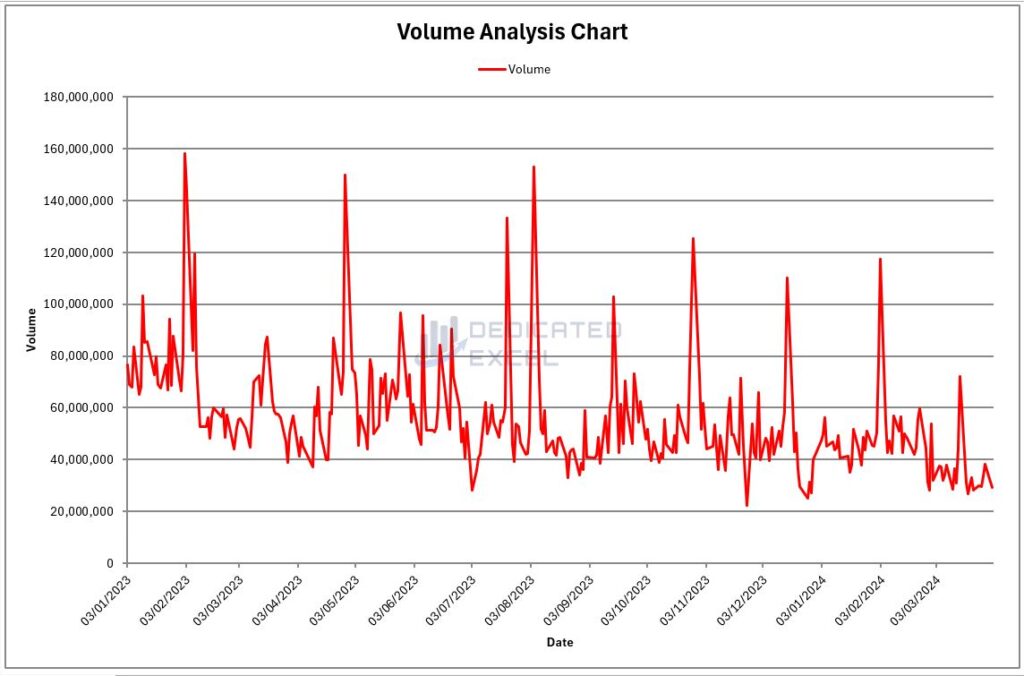
Volume Line Chart
The Volume Line Chart illustrates the quantity of a stock’s shares exchanged during a given timeframe of your choosing.
This chart effectively shines a light on the trading activity levels of the stock, serving as an indicator of its current demand and the fluidity with which you can buy or sell it.
Periods marked by high trading volumes often signal strong interest from the market, potentially leading to significant price fluctuations. Conversely, lower trading volumes might indicate a lack of activity, suggesting price stability.
By observing the volume of trades, you gain insights into market sentiment regarding the stock, understanding whether it is attracting or losing interest. This knowledge provides a more nuanced view of market dynamics, helping you make informed decisions.
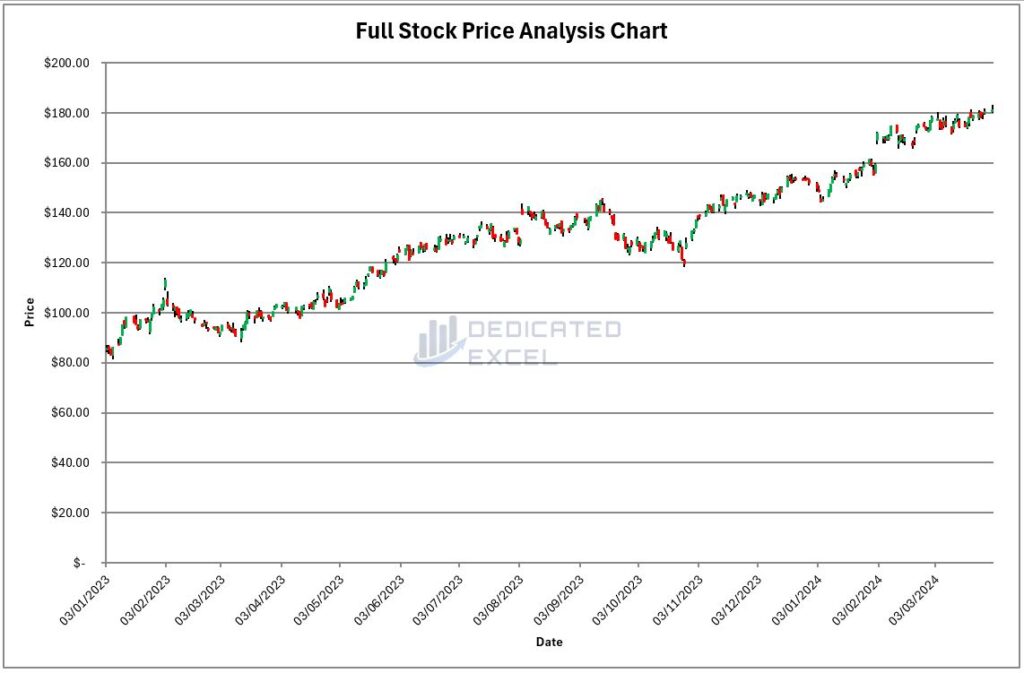
Full Price Chart
The Full Price Chart, often referred to by its technical name, the OHLC (Open, High, Low, Close) Chart, delivers an intricate snapshot of stock price movements.
Represented through bars for each trading interval, this chart delineates the full spectrum of price action. Green bars are used to signify intervals where the stock’s closing price exceeded its opening price, indicative of an upward trend.
Conversely, red bars highlight those periods where the closing price dipped below the opening, signaling a downward movement.
The colour coding employed by the Full Price Chart aids in quickly identifying the overall direction of stock movement, as well as the volatility between periods, providing a comprehensive view of market behavior.
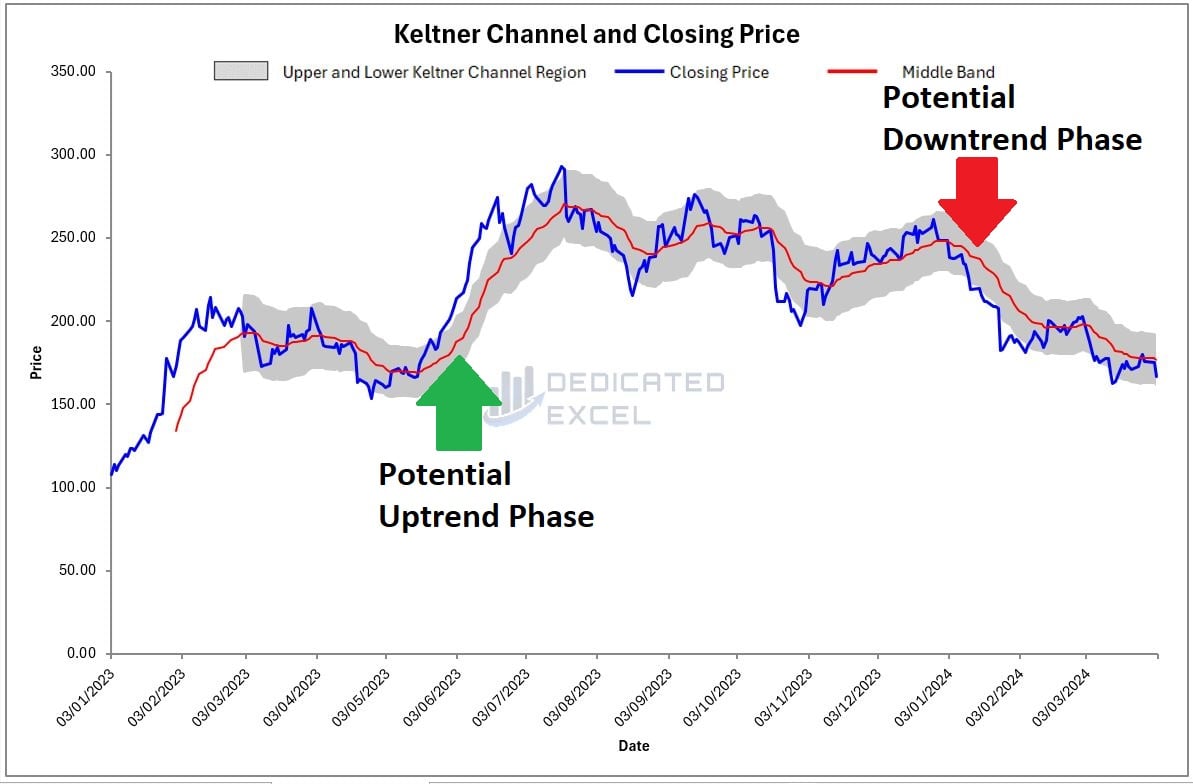
Keltner Channel Chart
The Keltner Channel Chart offers a comprehensive view of stock price movements, capturing both trend direction and volatility through its unique structure. Here’s a detailed breakdown of its components:
- Blue Line: This line represents the closing price of the stock over time. Its continuous tracking of day-to-day closing values offers a straightforward depiction of the stock’s price trajectory, enabling traders to observe how the stock settles each trading day.
- Red Line: Serving as the chart’s backbone, the red line is the Central Line of the Keltner Channel, calculated using the Exponential Moving Average (EMA) of the stock’s prices over the last 20 periods. It provides a smoothed representation of the stock’s average price over this timeframe, acting as a benchmark for identifying the trend over a longer term.
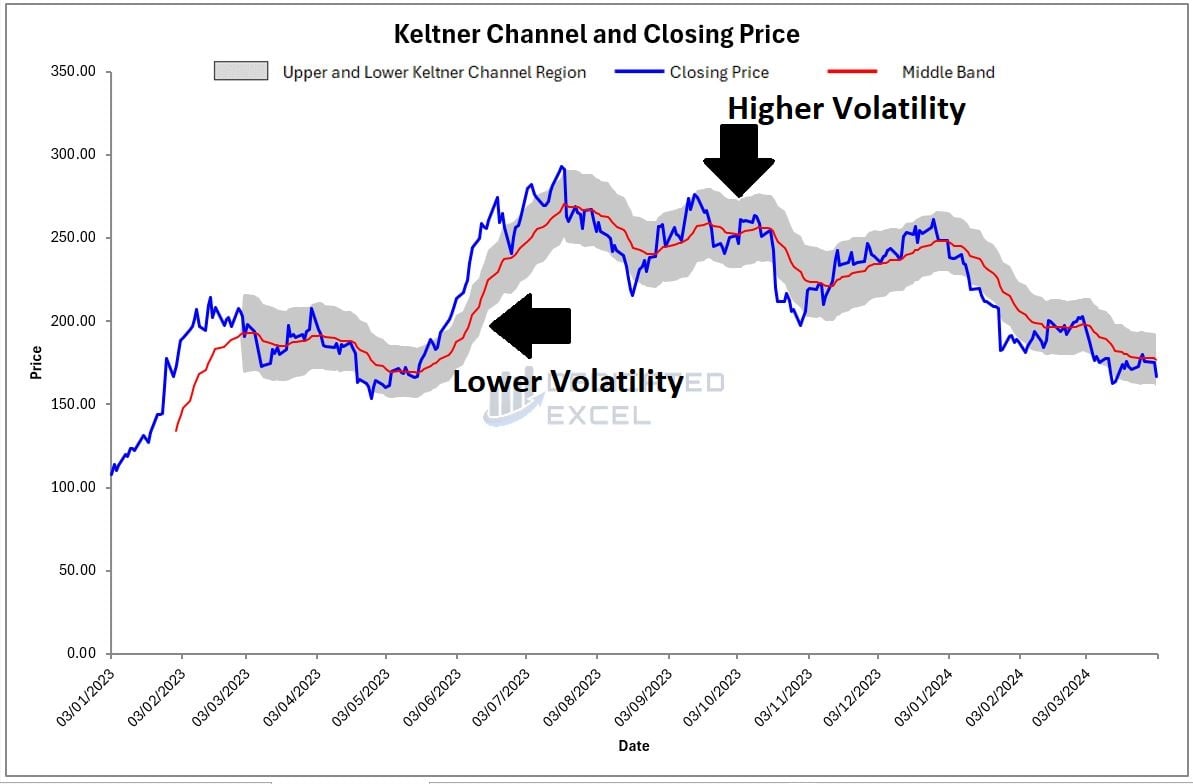
- Grey Shaded Region: The hallmark of the Keltner Channel Chart, this shaded area outlines the space between the upper and lower bounds of the channel. These boundaries are derived from the stock’s Average True Range (ATR), applied above and below the central EMA line to establish the channel’s limits.
The fluctuation in the width of this region is a direct reflection of market volatility: a wider channel indicates increased volatility, suggesting larger price movements and potential trading opportunities, while a narrower channel points to a period of lower volatility and more stable price action.
The Keltner Channel Chart is particularly valued for its ability to highlight potential breakouts or reversals by observing how prices interact with the channel boundaries, making it an indispensable tool for traders looking to capitalize on market trends and volatility.
How is the Keltner Channel Calculated?
Keltner Channels are a distinguished technical analysis tool that provide traders and investors with insights into trend direction and potential volatility, much like their counterpart, the Bollinger Bands.
The calculation and interpretation of Keltner Channels, however, follow a distinct methodology that emphasizes the Average True Range (ATR) of a stock, offering a different perspective on market dynamics.
- Middle Line: At the core of Keltner Channels is the Middle Line, which is typically calculated as a 20-period Exponential Moving Average (EMA) of the closing prices. Unlike the Simple Moving Average used in Bollinger Bands, the EMA gives more weight to recent prices, making the Keltner Channels more responsive to the latest market movements. This Middle Line serves as the baseline from which the upper and lower boundaries of the channel are determined, reflecting the central trend of the stock’s price over a specified period.
- Upper Band Calculation: The Upper Band is established by adding a multiple of the ATR (commonly set to two) to the Middle Line. This calculation frames the upper boundary of expected price action, marking where the stock price might be considered to extend beyond its typical range. The formula can be expressed as: Upper Band = Middle Line + ( 2 * ATR )
- Lower Band Calculation: Similarly, the Lower Band is determined by subtracting the same multiple of the ATR from the Middle Line. This sets the lower boundary, indicating a level below which the stock price is viewed as unusually low given recent volatility. The formula is: Lower Band = Middle Line ? ( 2 * ATR )
This method of using the ATR to define the channel’s width means that, like Bollinger Bands, Keltner Channels adapt to changes in market volatility.
However, by employing the ATR and EMA, Keltner Channels offer a unique lens through which volatility and trend strength can be assessed, distinguishing them from other technical analysis tools.
Useful Signals from The Keltner Channel Chart
Interpreting Keltner Channels provides traders with valuable insights into trend strength, volatility, and potential breakout signals. When analyzing a Keltner Channel chart several key observations can be made:
- Following the Middle Line: The red line (Middle Band) acts as a trend indicator. A consistently upward-moving Middle Band suggests an uptrend, whereas a downward trajectory indicates a downtrend. The slope of the Middle Band can give clues about the trend’s strength.

- Width of the Grey Shaded Area: The grey-shaded area between the Upper and Lower Bands represents the channel’s width, which is directly related to market volatility — wider channels indicate higher volatility, and narrower channels suggest lower volatility. Observing how the width changes over time can help anticipate future volatility.
- Price Touching the Upper or Lower Band: When the blue line (closing price) touches or breaches the Upper Band, it could indicate that the stock is overextended to the upside and might pull back. Conversely, if the price touches the Lower Band, the stock might be oversold and due for a rebound.
- Price Moving Within the Bands: A price consistently trading near the Upper Band suggests strong bullish momentum, while trading near the Lower Band indicates bearish momentum. Price remaining near the middle can signify a lack of strong direction in the market.
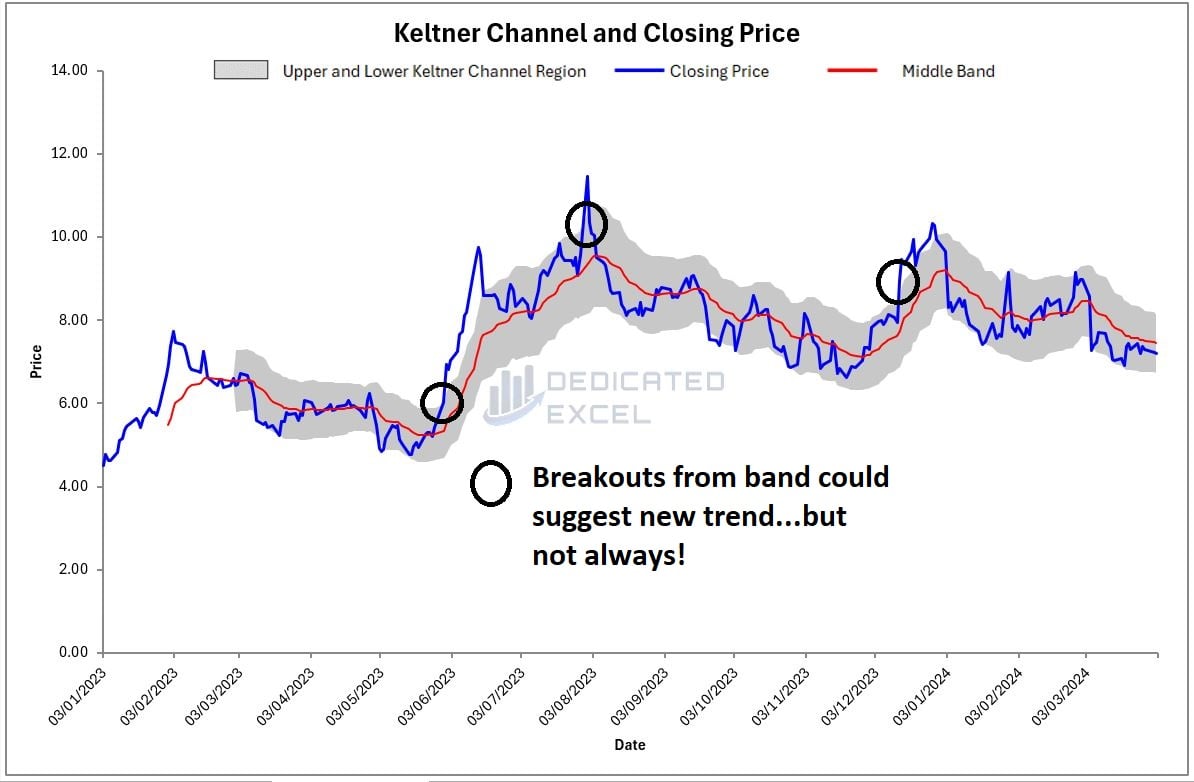
- Breakouts from the Channel: Significant breakouts from the channel, especially on high volume, can signal the start of a new trend. For example, a decisive move above the Upper Band might forecast a strong upward trend, while a drop below the Lower Band could suggest a forthcoming downtrend.

Download the Free Excel Keltner Channel Calculator
Download Free Excel Keltner Channel CalculatorSummary
The Free Excel Keltner Channel Calculator stands as a vital resource for traders aiming to navigate the complexities of market trends and volatility with ease. Centered around the Exponential Moving Average (EMA) for its Middle Line and utilizing the Average True Range (ATR) to establish the Upper and Lower Bands, this calculator offers a nuanced perspective on price movements.
This innovative tool enables users to swiftly gauge the strength of trends, pinpoint potential breakout signals, and discern buying or selling opportunities, all through the intuitive framework of an Excel spreadsheet.
Designed for both the novice and the experienced trader, the Excel Keltner Channel Calculator demystifies advanced market analysis, allowing for a deeper exploration of trading opportunities without reliance on sophisticated software.
As a comprehensive approach to market analysis is crucial for success, the Free Excel Keltner Channel Calculator is best used in conjunction with other analytical tools. To support a well-rounded trading strategy, consider integrating the following Free Excel Calculators available on our site:
- Excel Dollar Cost Averaging Calculator
- Excel ATR Calculator (Average True Range)
- Excel MACD Calculator (Moving Average Convergence Divergence)
- Excel RSI Calculator (Relative Strength Index)
- Excel GMMA Calculator (Guppy Multiple Moving Average)
- Excel Bollinger Bands Calculator
Leveraging these calculators together can significantly enhance your analysis, providing a solid foundation for making informed trading decisions and securing a competitive advantage in the market.
Keep Excelling,

Disclaimer: Please note this is not a tool aimed at providing financial advice, it merely showcases features of the Microsoft Excel software package.
The Free Excel Keltner Channel Calculator relies on external data sources for prices and performs various calculations, none of which have been independently validated. Please consult a qualified financial advisor before making any investments.
This file may not be published on other websites or file sharing services without written consent from the owner.